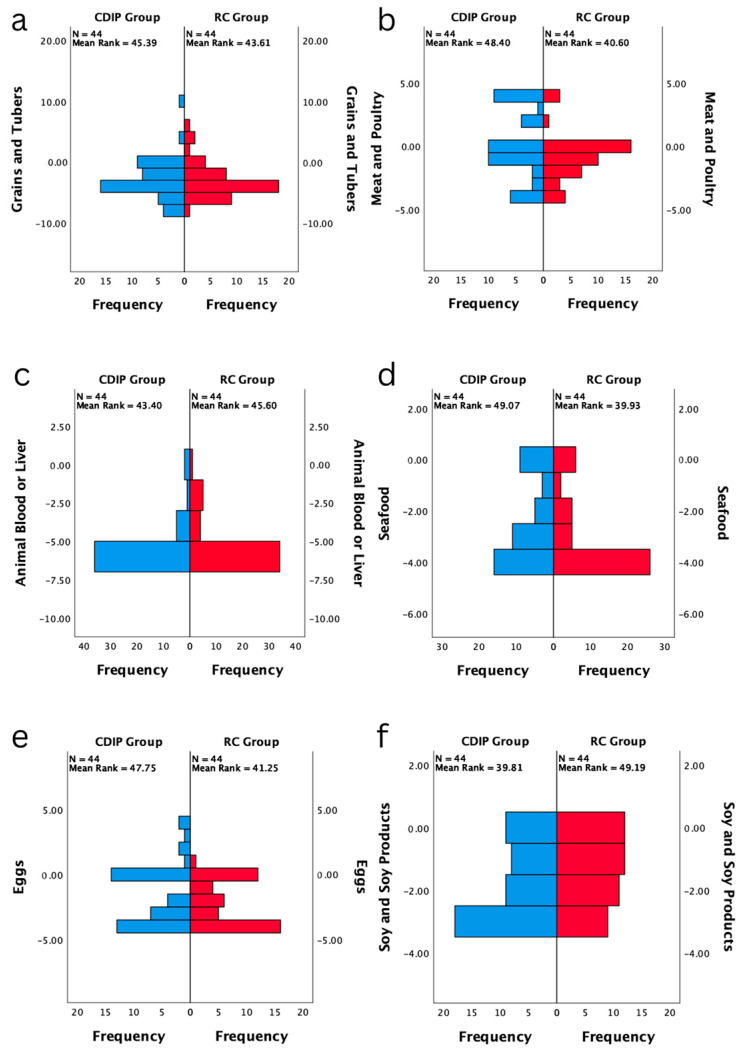
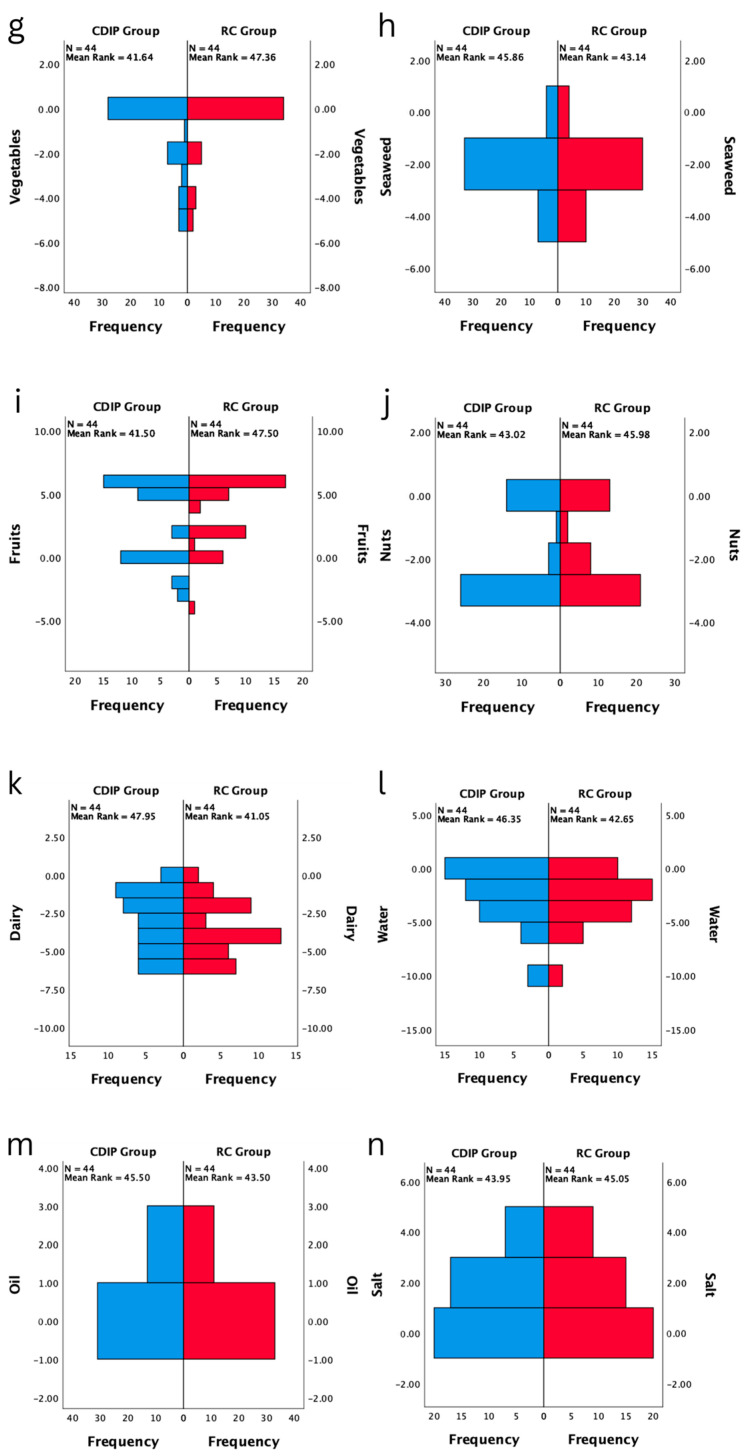
Figure 2.
Baseline comparison of balance coefficients for various nutrients in two groups (n = 88). Note: (a) represents the comparison of frequency distributions in the dietary balance index of grains and tubers between two post-test groups; (b) signifies the comparison of frequency distributions in the dietary balance index of meat and poultry between two post-test groups; (c) denotes the comparison of frequency distributions in the dietary balance index of animal blood or liver between two post-test groups; (d) indicates the comparison of frequency distributions in the dietary balance index of seafood between two post-test groups; (e) stands for the comparison of frequency distributions in the dietary balance index of eggs between two post-test groups; (f) illustrates the comparison of frequency distributions in the dietary balance index of soy and soy products between two post-test groups; (g) showcases the comparison of frequency distributions in the dietary balance index of vegetables between two post-test groups; (h) highlights the comparison of frequency distributions in the dietary balance index of seaweed between two post-test groups; (i) focuses on the comparison of frequency distributions in the dietary balance index of fruits between two post-test groups; (j) portrays the comparison of frequency distributions in the dietary balance index of nuts between two post-test groups; (k) outlines the comparison of frequency distributions in the dietary balance index of dairy between two post-test groups; (l) emphasizes the comparison of frequency distributions in the dietary balance index of water between two post-test groups; (m) represents the comparison of frequency distributions in the dietary balance index of oil between two post-test groups; (n) signifies the comparison of frequency distributions in the dietary balance index of salt between two post-test groups.


