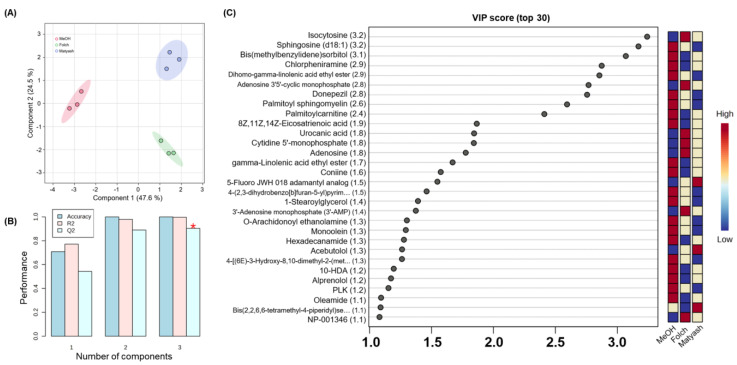
Figure 3.
Partial least squares discriminant analysis (PLS-DA) score plots and variable importance of projection (VIP) score plots: (A) PLS−DA scores plot of Huh−7 metabolite for three different methods; (B) cross−validation data showed cumulative values of R2 and Q2 (* = the highest value for performance measure); (C) the top 30 metabolites with highest VIP scores in tissues for three different methods.

