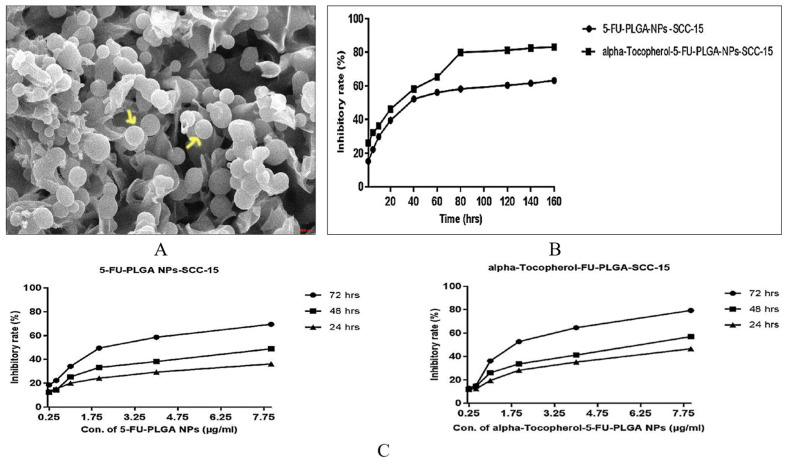
Figure 2.
(A) Scanning electron microscope of α-t-FU-PLGA/5-FU-PLGA NPs with spherical shape (yellow arrow) and no adherence between the particles. (B) Inhibition rate of α-t-FU-PLGA NPs and 5-FU-PLGA NPs on SCC-15 cells over time. (C) Inhibition rate of 5-FU-PLGA NPs (left) and α-t-FU-PLGA NPs (right) on SCC-15 cells at different concentrations. Reproduced with permission from ref. [68] (Copyright 2019 Medknow).

