Fig. 3.
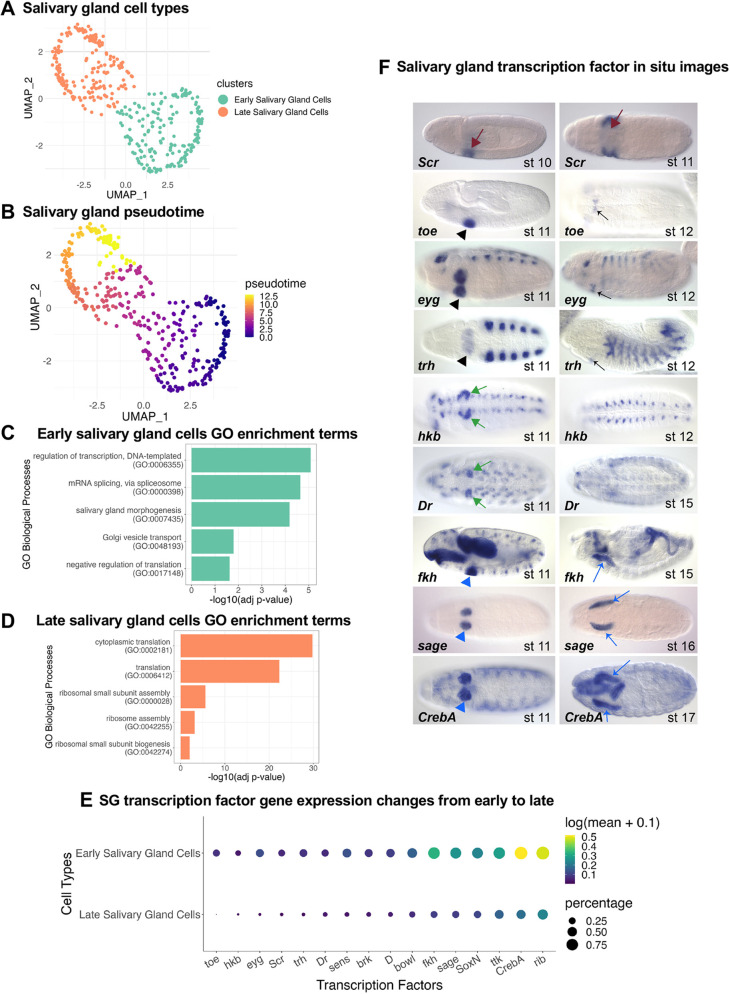
In-depth analysis of SG cells. (A,B) UMAP embedding of salivary gland (SG) cells colored by (A) SG sub-populations and (B) pseudotime ordering. (C,D) Selected enrichment of biological processes for (C) early and (D) late SG cells. For the full enrichment analysis results, see Table S6. (E) Expression pattern of SG-specific transcription factors (TFs) between early and late SG cells. The size of the dot represents the percentage of cells in the SG subtype in which the gene is detected; the color of the dot represents the mean expression of the gene in the SG subtype. (F) Selected in situ images of SG-specific TFs from the Berkeley Drosophila Genome Project across different stages. Black arrowheads, transient expression in the entire SG placode; black arrows, expression in the salivary duct; green arrows, transient expression in a subset of SG placode cells; red arrows, expression in SG precursors in stage 10 that disappears during stage 11; blue arrowheads, early expression of SG genes that are expressed persistently in the SG; blue arrows, late expression of SG genes that are expressed persistently in the SG.

