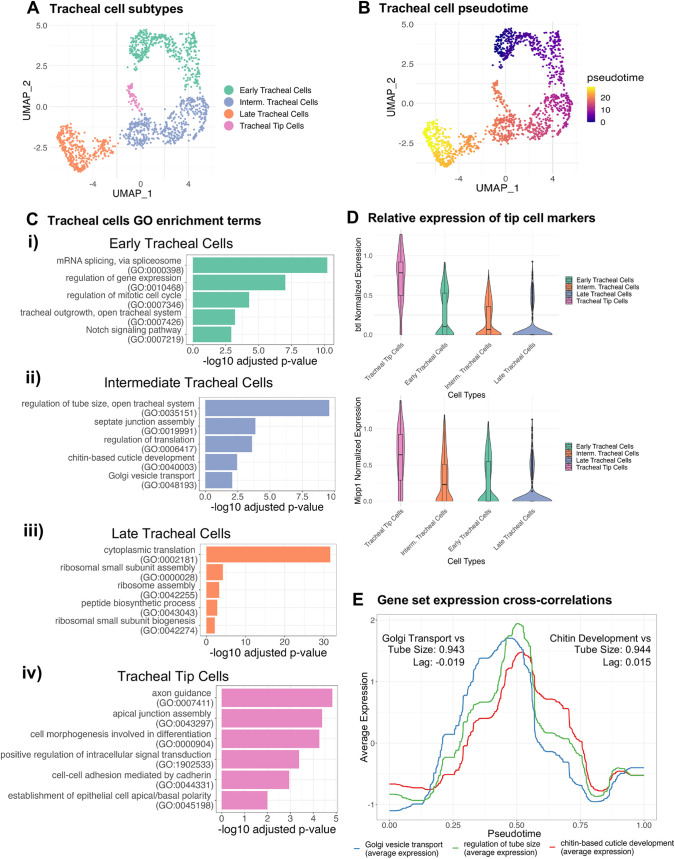
Fig. 4.
In-depth analysis of tracheal cells. (A,B) UMAP embedding of tracheal cells colored by (A) tracheal sub-populations and (B) pseudotime ordering. (C) Selected enrichment of biological processes for different sub-populations of tracheal cells: (i) early tracheal cells, (ii) intermediate tracheal cells, (iii) late tracheal cells and (iv) tracheal tip cells. For the full enrichment analysis results, see Table S8. (D) Normalized expression of tracheal tip cell markers btl and Mipp1 across different tracheal sub-populations. (E) The dynamic time-series of averaged and scaled gene set expression of ‘Golgi vesicle transport’, ‘regulation of tube size’ and ‘chitin-based cuticle development’ across pseudotime. The cross-correlation value and lag between Golgi Transport and Tube Size is on the left, and the cross-correlation value and lag between Chitin Development and Tube Size is on the right.

