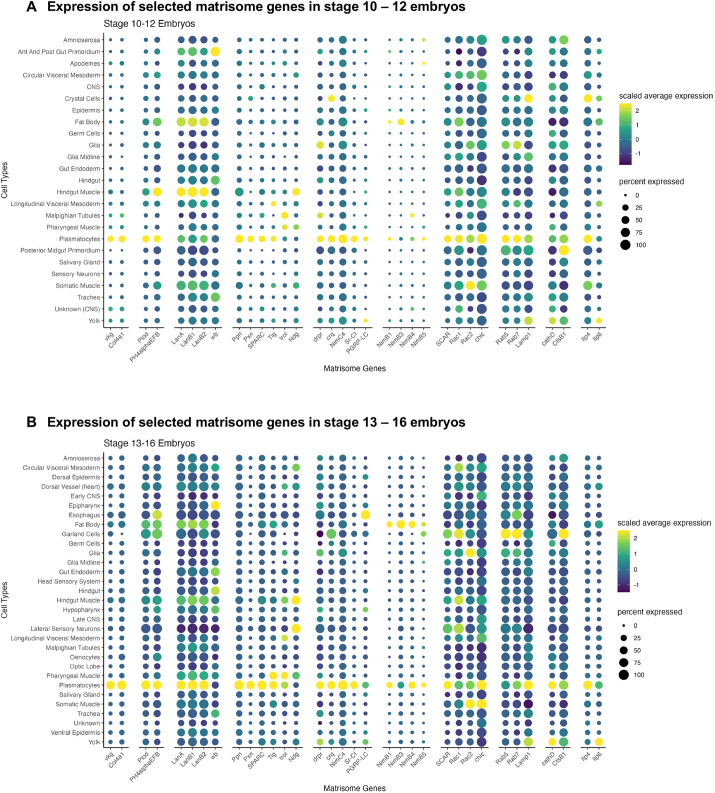
Fig. 6.
In-depth analysis of selected matrisomal genes across stage 10-12 and stage 13-16 embryonic cell types. (A,B) Dot plots of selected matrisomal genes across embryonic cell types in (A) stage 10-12 embryos and (B) stage 13-16 embryos. The size of the dot represents the percentage of cells in the embryonic cell type in which the gene is detected; the color of the dot represents the mean expression of the gene in the embryonic cell type.

