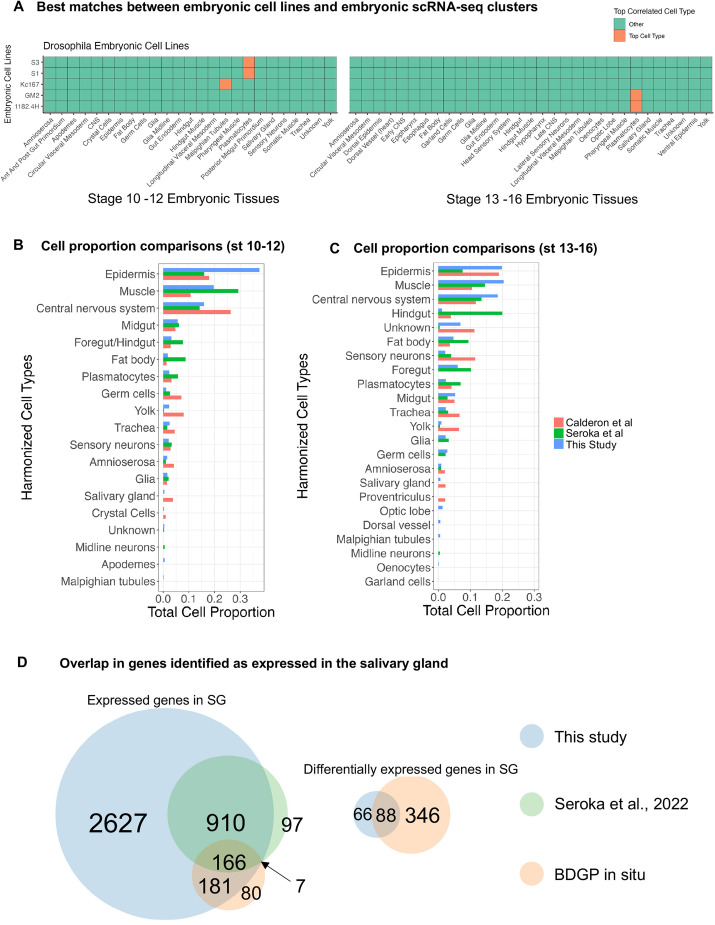
Fig. 7.
Alignment of Drosophila embryonic cell line transcriptional profiles with transcriptional profiles of embryonic cell types in stage 10-12 and stage 13-16. (A) Heatmap showing the best match between the bulk expression of embryonic cell lines and (stage 10-12 and stage 13-16) the pseudo-bulk expression of embryonic scRNA-seq cell types. The orange squares represent the cell type with which the embryonic cell lines are most correlated in terms of the transcriptional profiles of 1604 tissue marker genes. (B,C) Cell type proportion comparisons across three single-cell datasets: Calderon et al. (2022), Seroka et al. (2022) and this study for cells in (B) stage 10-12 and (C) stage 13-16. (D) Comparison of the number of genes detected in SG cells from this study, Seroka et al. (2022) and the Berkeley Drosophila Genome Project in situ hybridizations.

