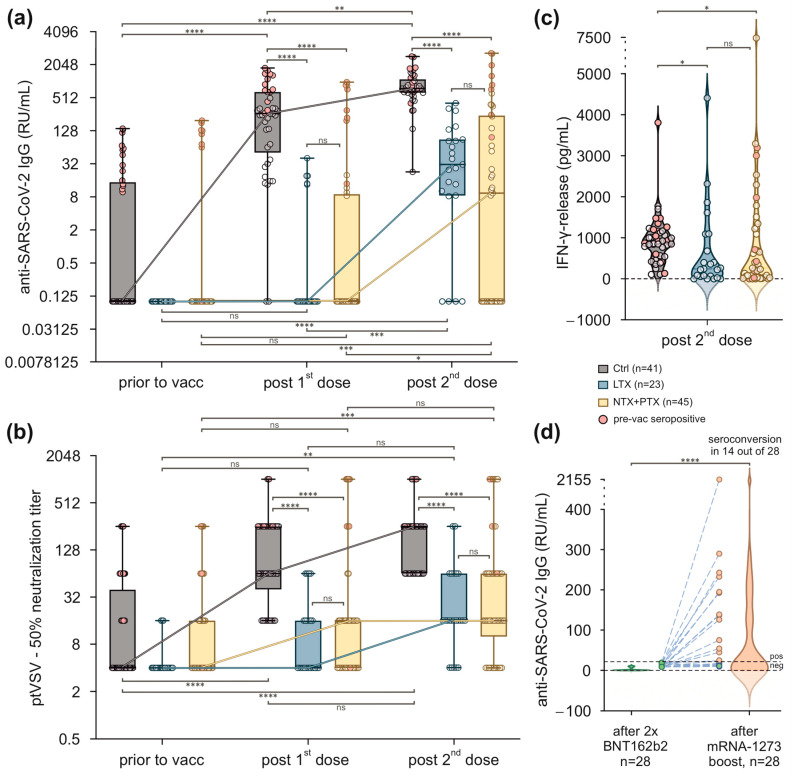
Figure 1.
Vaccination with BNT162b2 results in reduced humoral and cellular responses in SOT recipients. (a) Anti-SARS-CoV-2 IgG titres (RU/mL) in healthy controls, LTX, and NTX + PTX recipients. Each triplet represents data within the indicated timepoints before and after vaccination. Participants with a positive history of COVID-19 prior to vaccination (pre-vac seropositive) are indicated in red. Values below the assay’s threshold of 8 RU/mL were set at 0.1 RU/mL. Data were log2 transformed. (b) Functional testing of antibodies using spike-pseudotyped vesicular stomatitis viruses (ptVSV). Titres ≤ 1:4 were considered negative. Each triplet represents data from the indicated timepoints before and after vaccination. (c) SARS-CoV-2 spike protein-specific T cells were studied by interferon-γ release assay (IGRA) in the indicated groups after two vaccinations at day 49. (d) Anti-SARS-CoV-2-Ig after booster vaccination with mRNA-1273. Combined violin- and scatterplots of SARS-CoV-2 IgG titres in SOT recipients after the second vaccination and after the third booster vaccination. A total of 14 out of 28 SOT recipients achieved a seroconversion. (a,b) Box plots represent values as median (bold horizontal line), 75% confidence interval (box), and minimum and maximum values (whiskers). Dot clouds represent individual values, and the numbers are indicated. * p < 0.05; ** p < 0.01; *** p < 0.001; **** p < 0.0001; paired data were analysed by Friedman test followed by Dunn’s multiple comparison. (c,d) Each violin plot represents the distribution of IFN-γ (pg/mL) for individual groups, with the dashed line indicating the median and the dotted lines representing 75% confidence intervals. Each data point represents one participant. Kruskal–Wallis ANOVA followed by Dunn’s multiple comparison test. (a–d) Crtl = healthy control; LTX = liver transplant recipients; NTX + PTX = kidney + kidney/pancreas recipients.

