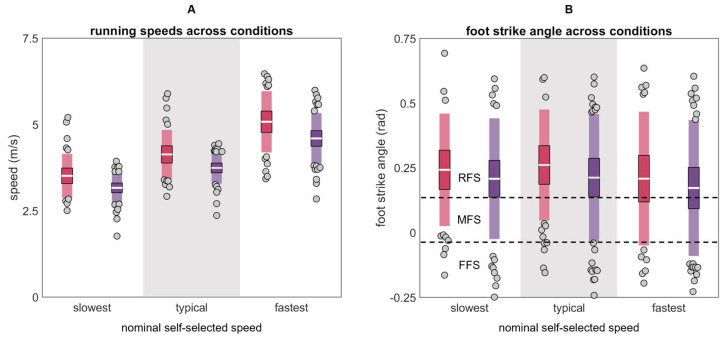
Figure 3.
(A) Mean speeds and (B) foot strike angles calculated from markers on the lateral calcaneus and base of the fifth metatarsal for males (red) and females (purple) across the slowest, typical, and fastest conditions (RFS is rear foot strike, MFS is mid foot strike, and FFS is fore foot strike [43]). The white horizontal line represents the mean; dark colors represent ±95% confidence interval (±1.96 SEM) around the mean; and light colors represent ±1 SD around the mean. Gray dots represent participants outside ±1 SD.

