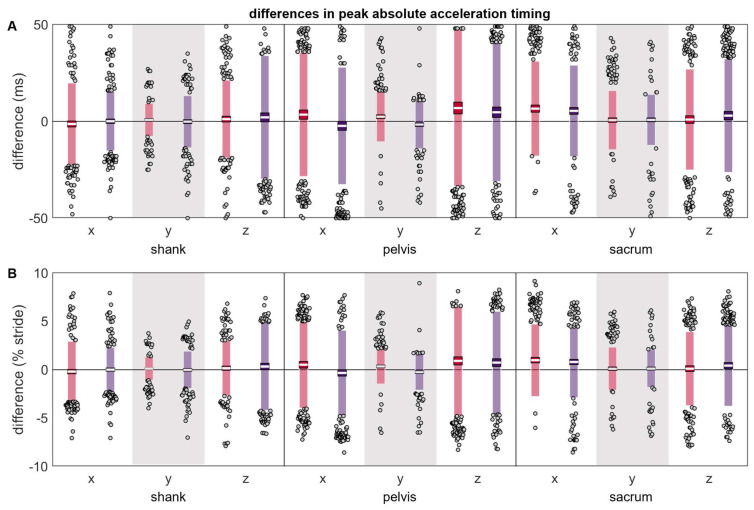
Figure 6.
(A) absolute and (B) normalized differences between peak timings measured simultaneously by the reference IMU and the misplaced IMU (red represents anterior- or left-proximal misplacement; purple represents posterior- or right-proximal misplacement). The white line represents the mean observed difference across trials (bias), the dark-colored box represents the confidence interval about the mean (±1.96 SEM), the light-colored box represents the limits of agreement (±1.96 SD), and the grey dots represent trials falling outside the limits of agreement (with trials falling outside the axis limits plotted at the limit). Positive differences indicate the misplaced peak occurred after the reference peak, while negative differences indicate the misplaced peak occurred before the reference peak.

