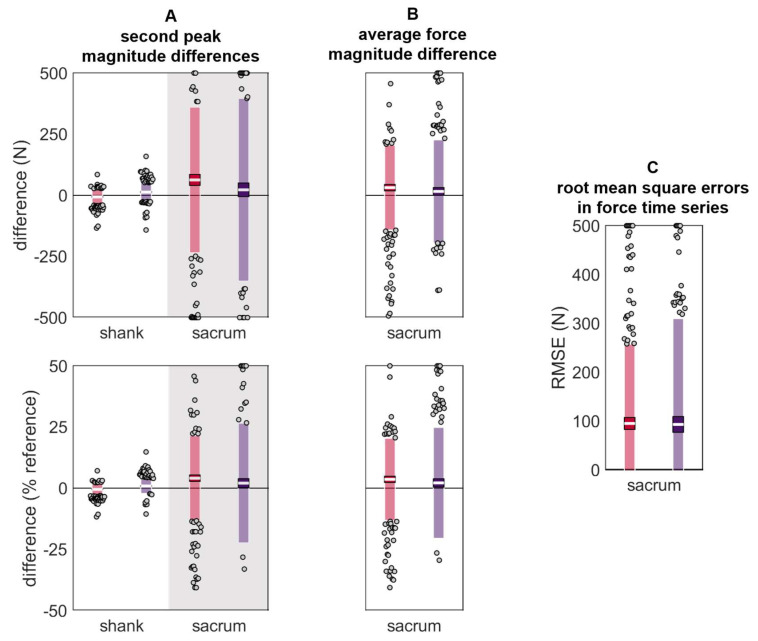
Figure 11.
Differences in (A) vertical ground reaction force second peak magnitude, (B) average vertical ground reaction force during stance, and (C) vertical ground reaction force time series during stance. Estimated using data from the reference IMU and the misplaced IMU (red represents anterior- or left-proximal misplacement; purple represents posterior- or right-proximal misplacement). The white line represents the mean observed difference across trials (bias), the dark-colored box represents the confidence interval about the mean (±1.96 SEM), the light-colored box represents the limits of agreement (±1.96 SD), and the grey dots represent trials falling outside the limits of agreement (with trials falling outside the axis limits plotted at the limit). For (A) and (B), positive differences indicate that the misplaced IMU estimated a higher magnitude than the reference, while negative values indicate that the misplaced IMU estimated a lower magnitude than the reference.

