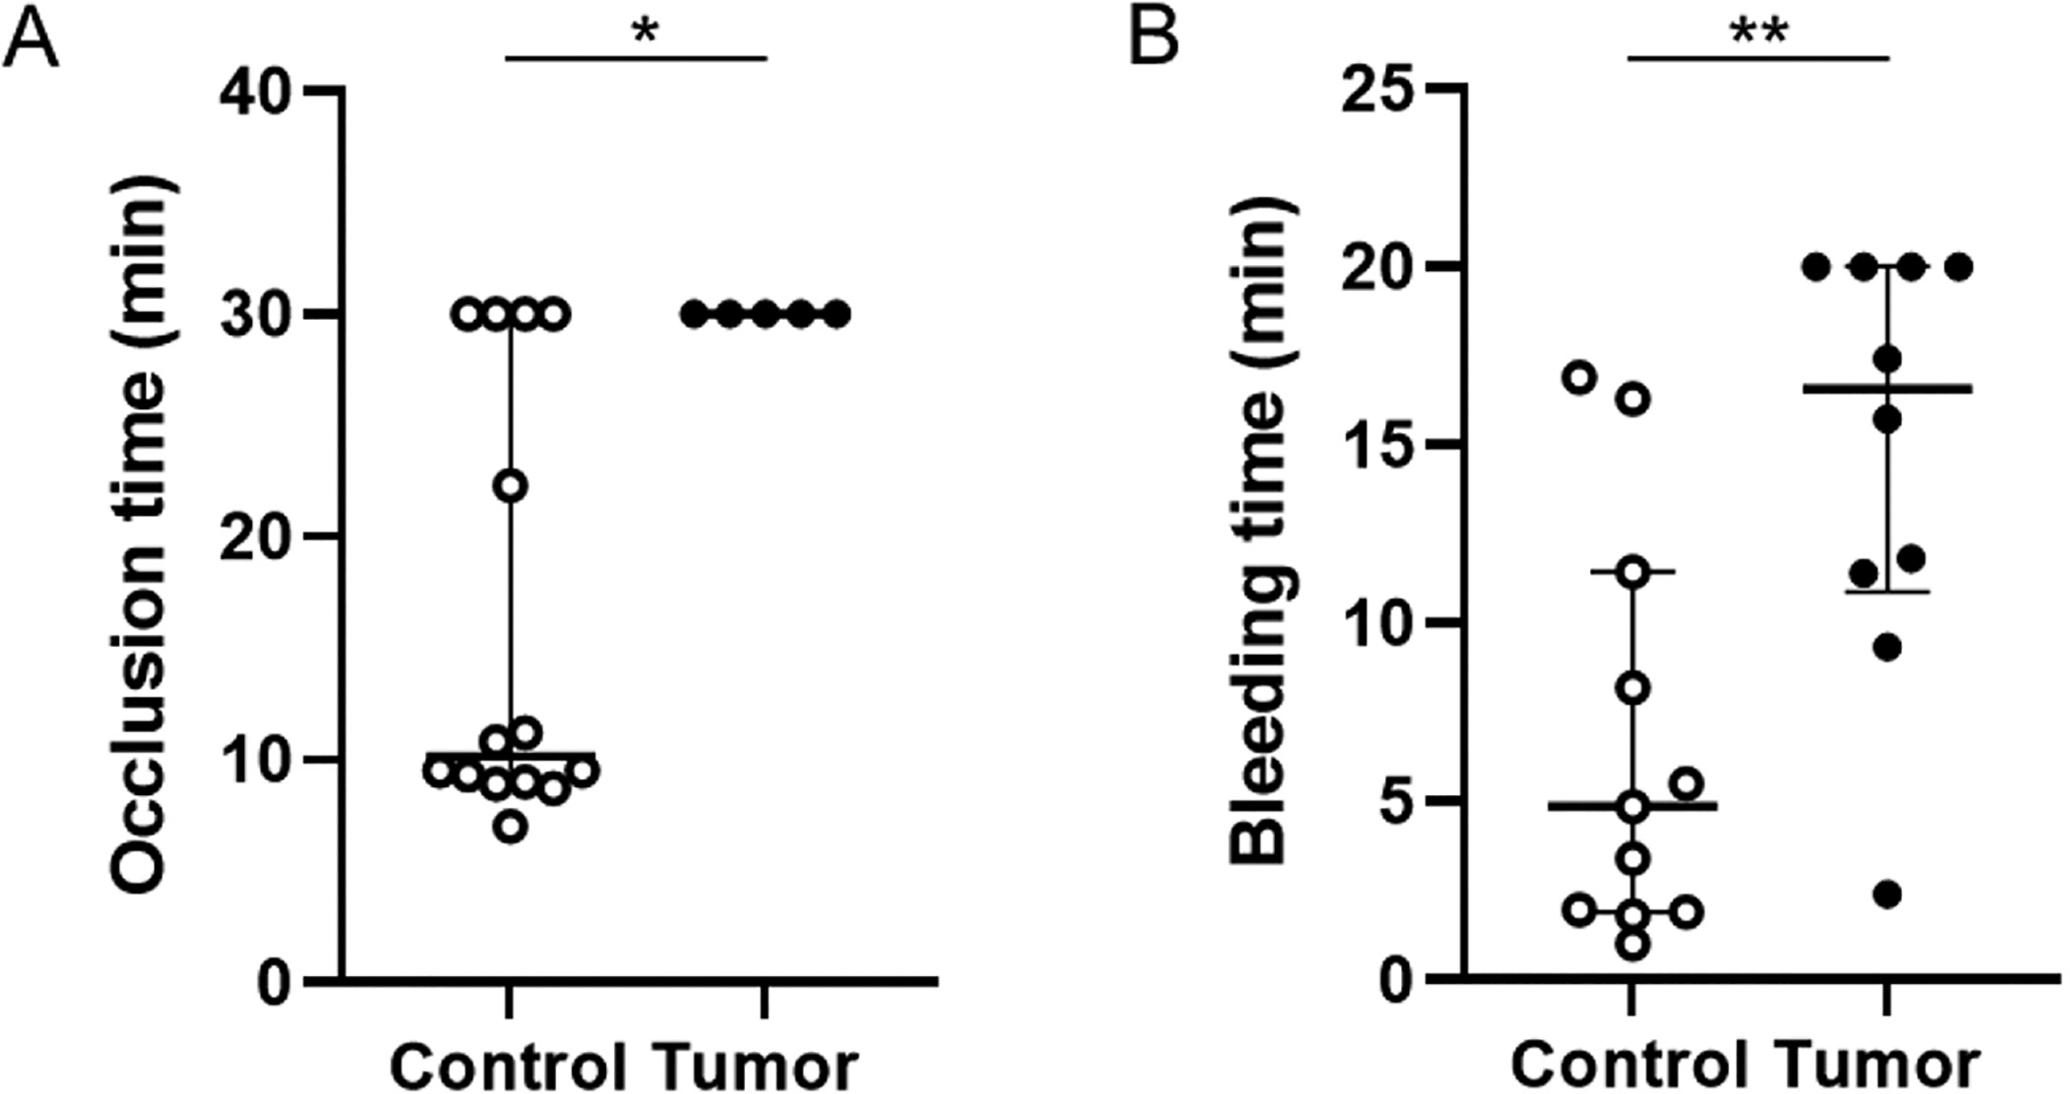
Fig. 1.

Carotid artery occlusion time and tail bleeding in control mice and tumor-bearing mice. (A) Carotid artery occlusion times in control mice (n = 14) and tumor-bearing mice (n = 5). (B) Tail bleeding times in control mice (n = 11) and tumor-bearing mice (n = 10). All data are shown as median (IQR) and analyzed by the Mann–Whitney test. *p < 0.05, **p < 0.01. IQR, interquartile range.
