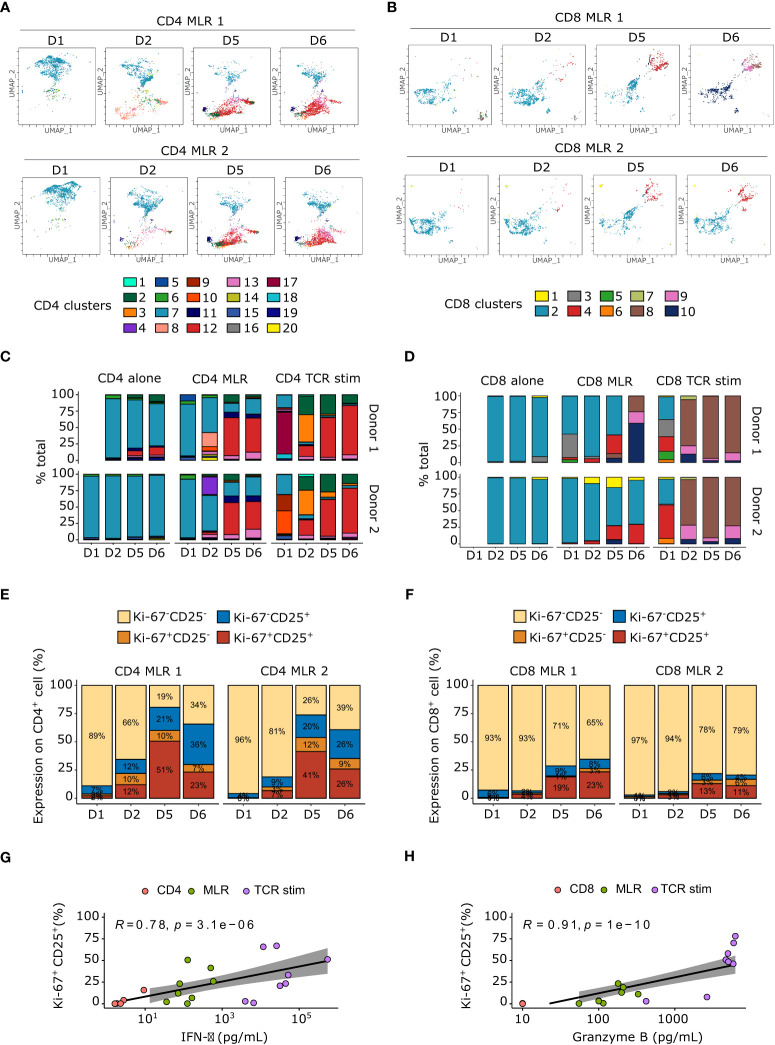
Figure 2.
Immunoreactive Ki-67+CD25+ cell populations increase over time upon MLR stimulation. (A, B) Flow cytometry UMAP dimensionality reduction representation of CD4+ (A) and CD8+ (B) T cells upon MLR stimulation colored by non-supervised clustering. (C, D) Barplot of cell proportions colored by non-supervised clustering for CD4+ (C) or CD8+ T cells. (E, F) Barplot of Ki-67 and CD25 expression upon CD4 (E) or CD8 (F) MLRs. (G) Spearman correlation between IFN-γ secretion and percentage of Ki-67+CD25+ in CD4+ T cells. (H) Spearman correlation between granzyme B secretion and percentage of Ki-67+CD25+ in CD8+ T cells. TCR stim: T cells stimulated with anti-CD3 and anti-CD28 antibodies.

