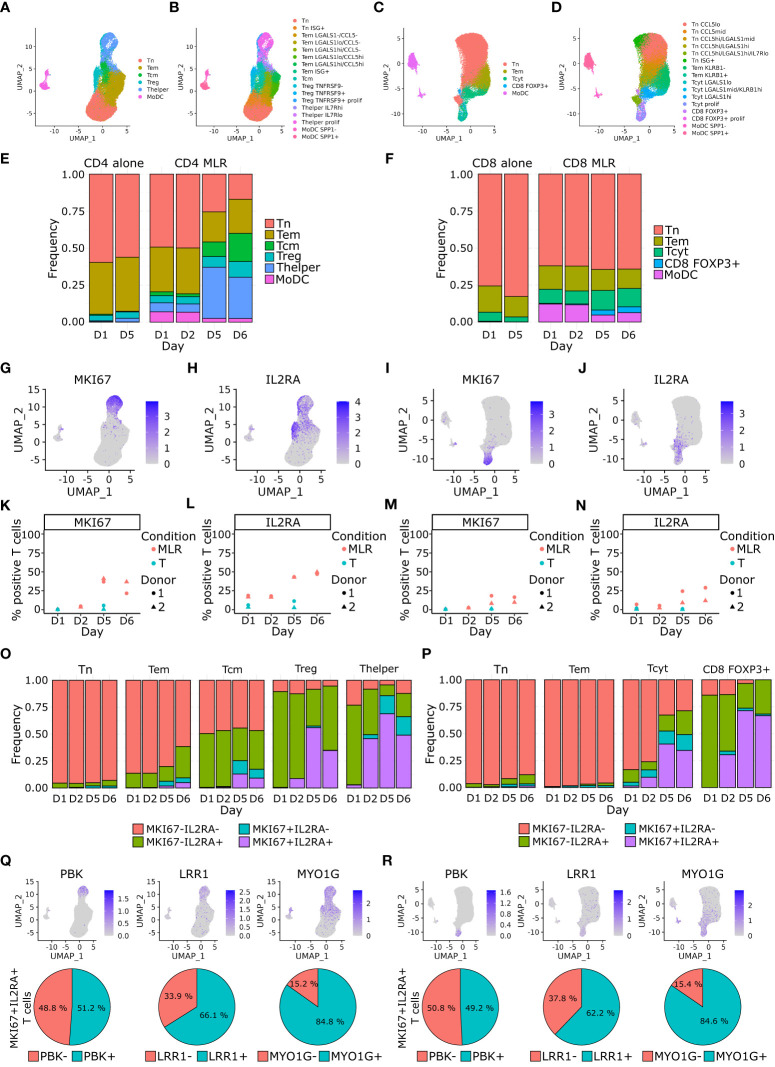
Figure 3.
CD4+ Tcm, Treg and Thelper cells, and CD8+ Tcyt cells proportions increase over time upon MLR stimulation and acquire a proliferative phenotype. (A–D) Single cell RNA-seq UMAP representation of cells main (A) and detailed phenotypes (B) in the CD4 MLR, and CD8 MLR (C, D). (E, F) Barplot of cells proportions colored by main phenotype in the CD4 MLR (E), and CD8 MLR (F). (G–J) UMAP representation of RNA expression for the indicated genes in the CD4 MLR (G, H), and CD8 MLR (I, J). (K–N) Follow up of the percentage of positive T cells for the indicated genes in the CD4 MLR (K, L), and CD8 MLR (M, N). (O, P) Barplot of MKI67-IL2RA co-expression proportions by main phenotype in the CD4 MLR (O), and CD8 MLR (P). (Q, R) UMAP representation of RNA expression (upper panel) and percentage of positive MKI67+IL2RA+ T cells (lower panel) for indicated genes in the CD4 MLR (Q), and CD8 MLR (R).

