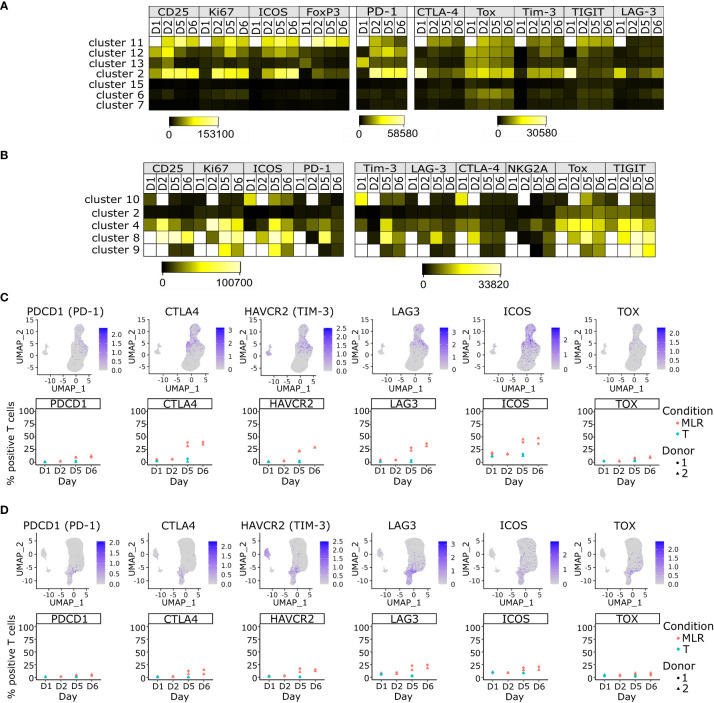
Figure 4.
ICPs are mainly expressed by immunoreactive T cells and their expressions increase over time upon MLR stimulation. (A, B) Heatmap of the mean fluorescent intensity of each indicated marker per non-supervised clustering over time upon MLR-stimulation in the CD4 MLR (A), or CD8 MLR (B) (C, D) UMAP representation of RNA expression and follow up of the percentage of positive T cells for the indicated genes in the CD4 MLR (C), and CD8 MLR (D).

