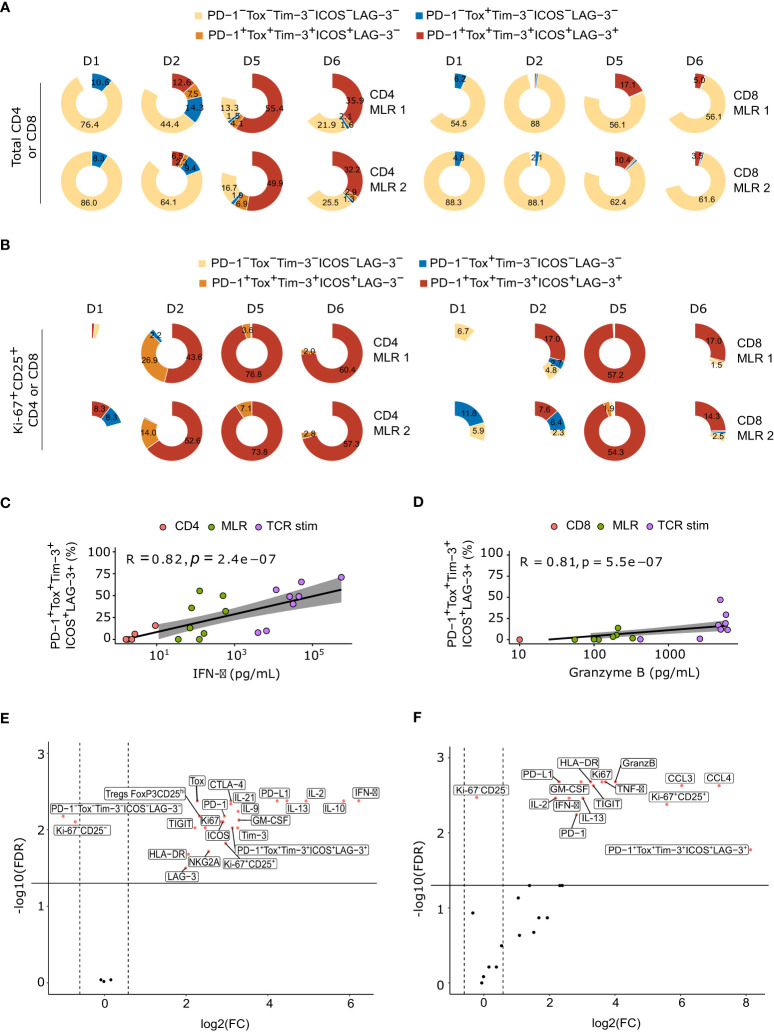
Figure 5.
MLR-stimulated T cells are characterized by the co-expression of ICPs over time. (A) Pie plot of the percentage of ICPs co-expression at each timepoints in total CD4+ T cells (left panel) or total CD8+ T cells (right panel), for each donor. (B) Pie plot of the percentage of ICPs co-expression at each timepoints in Ki-67+CD25+ CD4+ T cells (left panel) or Ki-67+CD25+ CD8+ T cells (right panel), for each donor. (C) Spearman correlation between IFN-γ secretion and percentage of ICPs co-expression in CD4+ T cells. (D) Spearman correlation between granzyme B secretion and percentage of ICPs co-expression in CD8+ T cells (E, F) Volcano plots of Log10 transformed Wilcoxon rank-sum test P and the log10-transformed ratio according to soluble factors and flow cytometry markers of MLR-stimulated versus non-stimulated CD4+ T cells (E) or CD8+ T cells (F). TCR stim: T cells stimulated with anti-CD3 and anti-CD28 antibodies.

