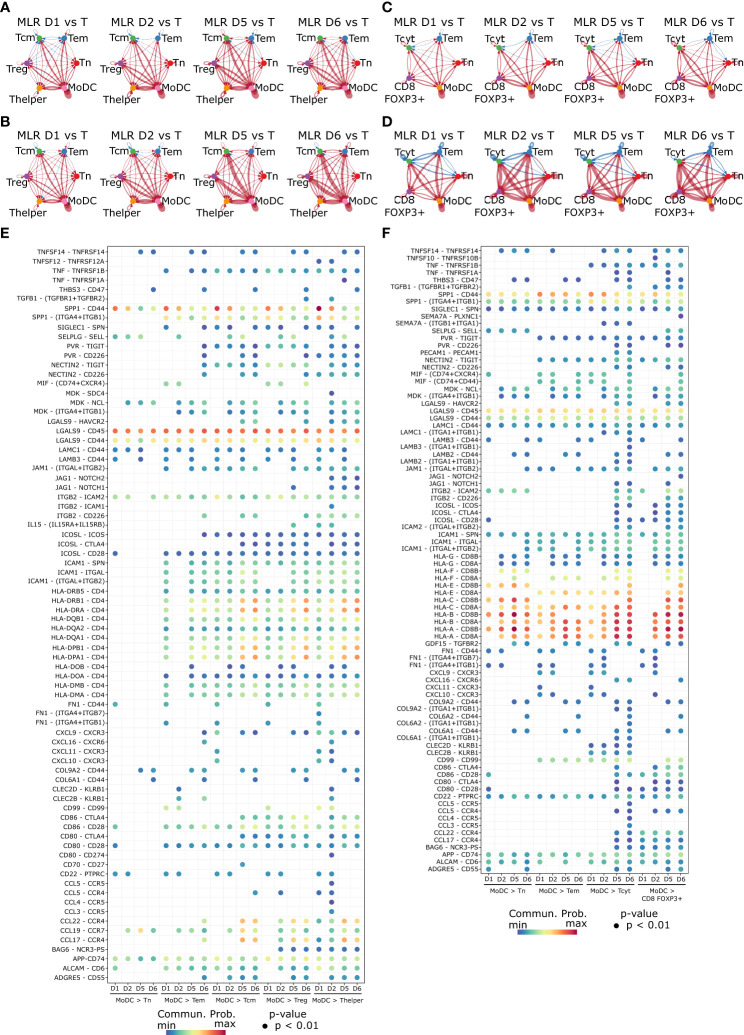
Figure 6.
Cell-cell communication network inference highlights components of the immunological synapse occurring between MoDCs and T cells in the MLR. (A–D) Circle plot representing the differential number of interactions (A) or the interaction strength (B) in the cell-cell communication networks for the CD4 MLR, and CD8 MLR (C, D). The width of edges represents the relative number of interactions or interaction strength. Red (or blue) colored edges represent increased (or decreased) signaling in the second dataset compared to the first one. (E, F) Bubble plot showing the ligand-receptor pairs involvement in MoDCs to T cells communication in the CD4 MLR (E), and CD8 MLR (F). Color represents the communication probability and size represents the p-value.

