Figure 7.
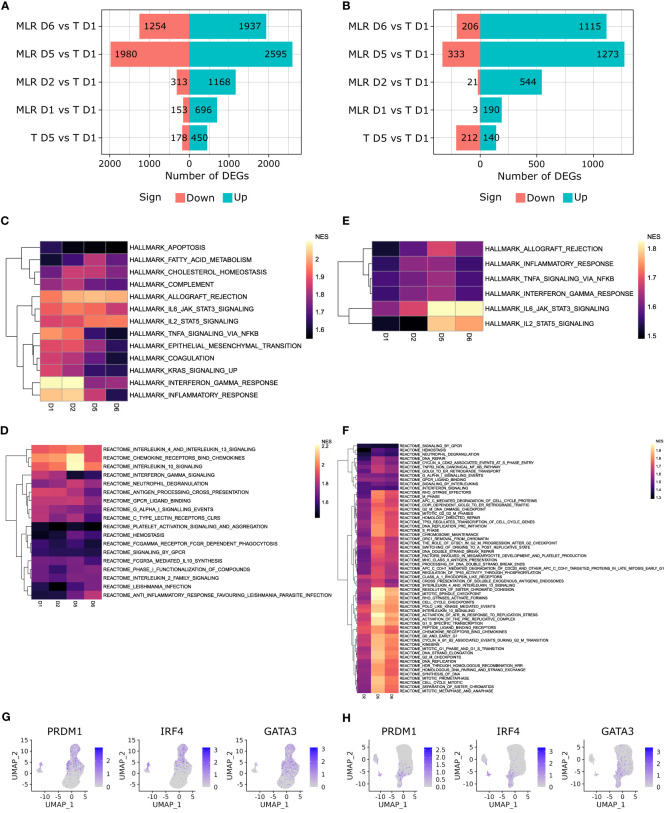
T cells activation signaling have differential kinetics between CD4 and CD8 MLRs. (A, B) Pyramid plot representing the number of DEGs over time in the CD4 MLR (A), and CD8 MLR (B). (C, D) Heatmap of NES for Hallmark gene sets enriched with adjusted p-value < 0.01 in MLR at all timepoints but not in non-stimulated T cells at day 5 versus day 1 in the CD4 MLR (C), and CD8 MLR (D). (E, F) Heatmap of NES for Reactome gene sets enriched with adjusted p-value < 0.05 in MLR at all timepoints but not in non-stimulated T cells at day 5 versus day 1 in the CD4 MLR (E), and CD8 MLR (F). (G, H) UMAP representation of indicated genes expression in the CD4 MLR (G), and CD8 MLR (H).

