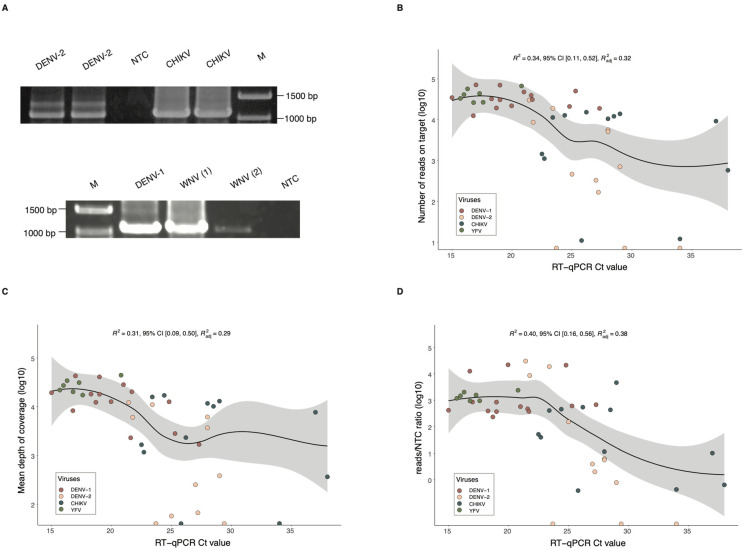
Figure 2.
Sequencing performance of the Ampli-FlaCk protocol. (A) Electrophoresis analysis of RT-PCR products from cultured dengue virus type 2 (DENV-2, Ct = 22) and Chikungunya virus (CHIKV, Ct = 33), in duplicates (top image). The bottom image displays electrophoresis results for cultured dengue virus type 1 (DENV-1, Ct = 25) and West Nile virus (WNV, numbers in parentheses represent samples having different Ct values, 1 = 21, and 2 = 33). M = Marker. Images were cropped and converted to grayscale for clarity; see the Data Availability Statement for original, unedited images. (B) Distribution of the number of reads on target and the RT-qPCR Ct values from the clinical specimens (n = 45) used for testing the protocol. (C) Distribution of the mean depth of coverage and the RT-qPCR Ct values from the tested clinical specimens (n = 45). (D) Distribution of the reads/NTC ratio and the RT-qPCR Ct values from the tested clinical specimens (n = 45). (B–D) The dark blue line represents a smooth local regression line (method = LOESS), and the light grey area around the trend line represents the 95% confidence interval.

