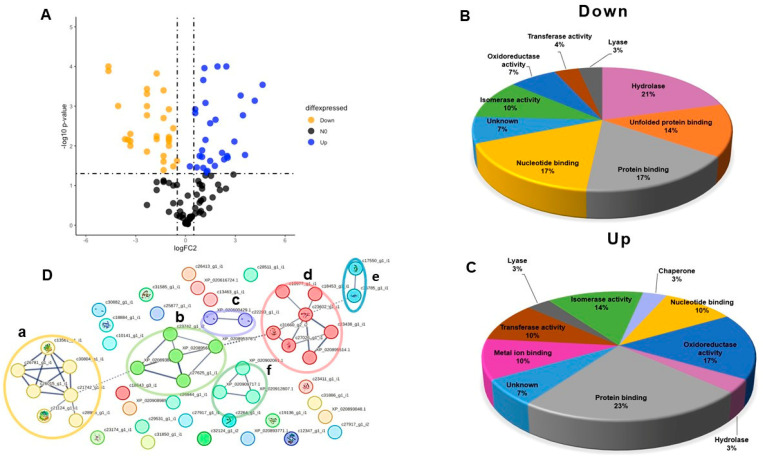
Figure 4.
Differentially expressed proteins from proteomes of A. dowii and L. neglecta. (A) shows the volcano graph that represents the changes in the expression of 59 proteins present in both samples. The x-axis shows the log fold change of the L. neglecta/A. dowii ratio, while the y-axis shows the −log probability that was computed (p-value), associated with Student’s t-test. Orange dots indicate significantly downregulated proteins and blue dots indicate upregulated proteins. In (B,C), pie diagrams are shown with the lower and higher functional annotations, respectively, showing the differentially expressed proteins. In (D), protein–protein interaction network is shown. The circles indicate the interaction nodes and these are also indicated with parenthesis. a, proteins of sugar metabolism; b, proteins related to the stress response and the metabolism of reactive oxygen species; c, structural proteins; d, groups proteins that participate in protein folding; e and f, groups enzymes that participate in the modification of proteins and extracellular enzymes that act in the degradation of chitin, respectively.

