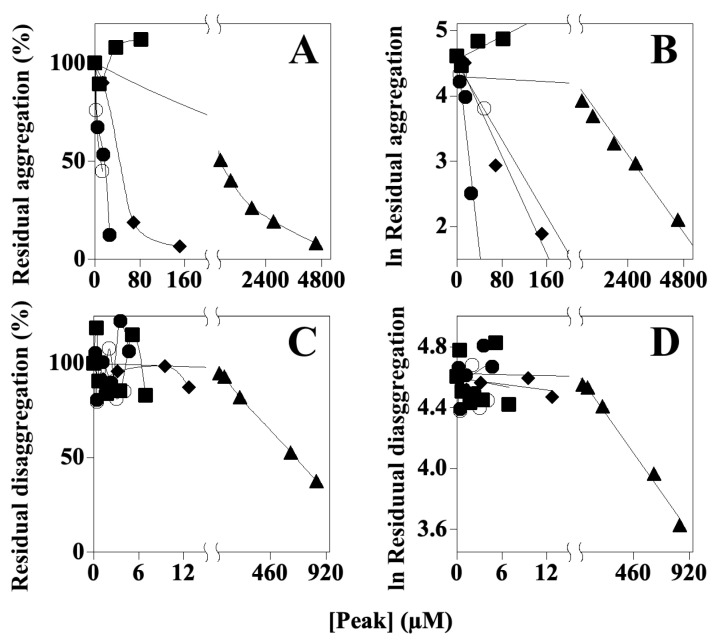
Figure 5.
Effects of AFPE and Peaks 1–4 on Aβ 1–40 self-aggregation and disaggregation processes in vitro: The graphs show the residual fibril aggregation (A,B) or disaggregation (C,D) processes, determined in the absence or in the presence of the indicated concentrations of protein for Peak 1 (black circles) or polyphenols for AFPE (black triangles), Peak 2 (empty circles), Peak 3 (black squares), and Peak 4 (black diamonds), as reported in Section 2. Values are expressed as percentages with respect to control samples, in the absence of peak components. The data from semi-logarithmic plots (b,d) allowed for the calculation of the IC50 values that are reported in Table 2.

