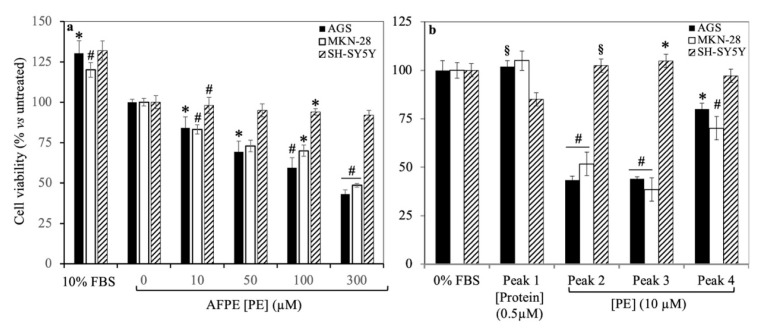
Figure 7.
Effects of AFPE and Peaks 1–4 on the viability of AGS, MKN-28, and SH-SY5Y cells: Cells kept in serum-free medium were treated with the indicated amounts of (a) AFPE or (b) Peaks 1–4 for 24 h and then subjected to MTT assay. The data from semi-logarithmic plots allowed for the calculation of AFPE’s IC50 value. For each treatment, the values are expressed as percentages with respect to untreated control cells (set as 100%) kept in serum-free medium. Data represent the mean ± SEM (n = 3) of three independent experiments performed in triplicate. The statistical significance of the treated samples compared to control cells (cultured in serum-free medium) was determined by one-way analysis of variance (ANOVA), followed by Bonferroni’s test. Significant differences from the untreated control cells were considered as follows: * p < 0.05; § p < 0.01; # p < 0.001.

