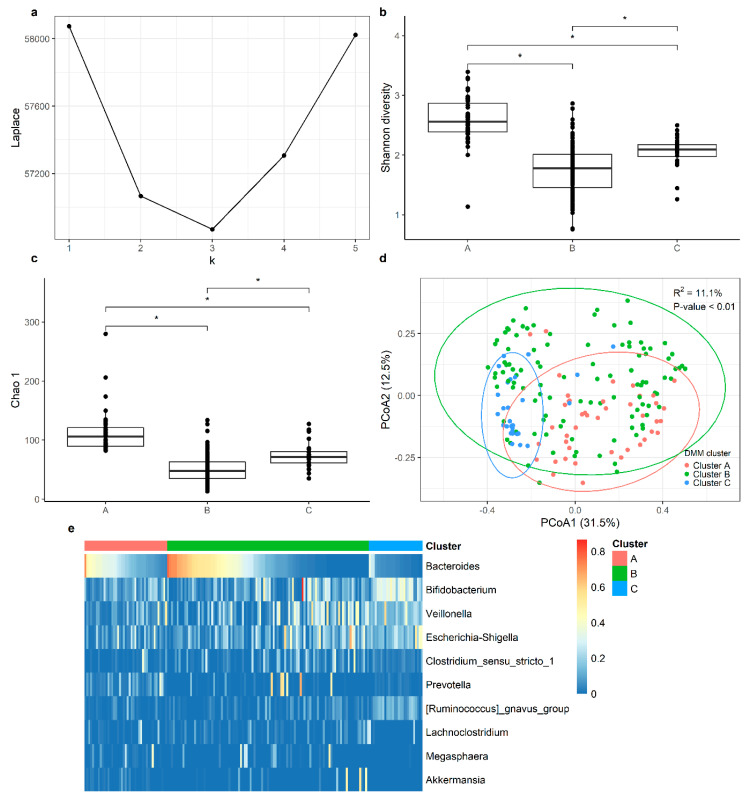
Figure 1.
Dirichlet multinomial mixture clustering identified three optimal clusters from 159 fecal samples. (a) The number of clusters (k = 3) was chosen by selecting the minimal Laplace approximation, as per the negative log model’s evidence. (b,c) Boxplot of the alpha diversity (Shannon and Chao 1) distributed between the three clusters. Group differences were tested using Wilcoxon signed-rank test, and p-values were adjusted for multiple testing using Bonferroni. The adjusted p-value < 0.05 was labeled as *, and the adjusted p-value ≥ 0.05 was labeled as NS. (d) Principal component analysis (PCoA) ordinations of variation, based on the Bray–Curtis distance matrix. R2 and the p-value were calculated using the univariate PERMANOVA test. (e) Heatmap of relative abundance of the top 10 genera in the three clusters. Within the clusters, samples were ordered in accordance with the relative abundance of the genus, Bacteroides.

