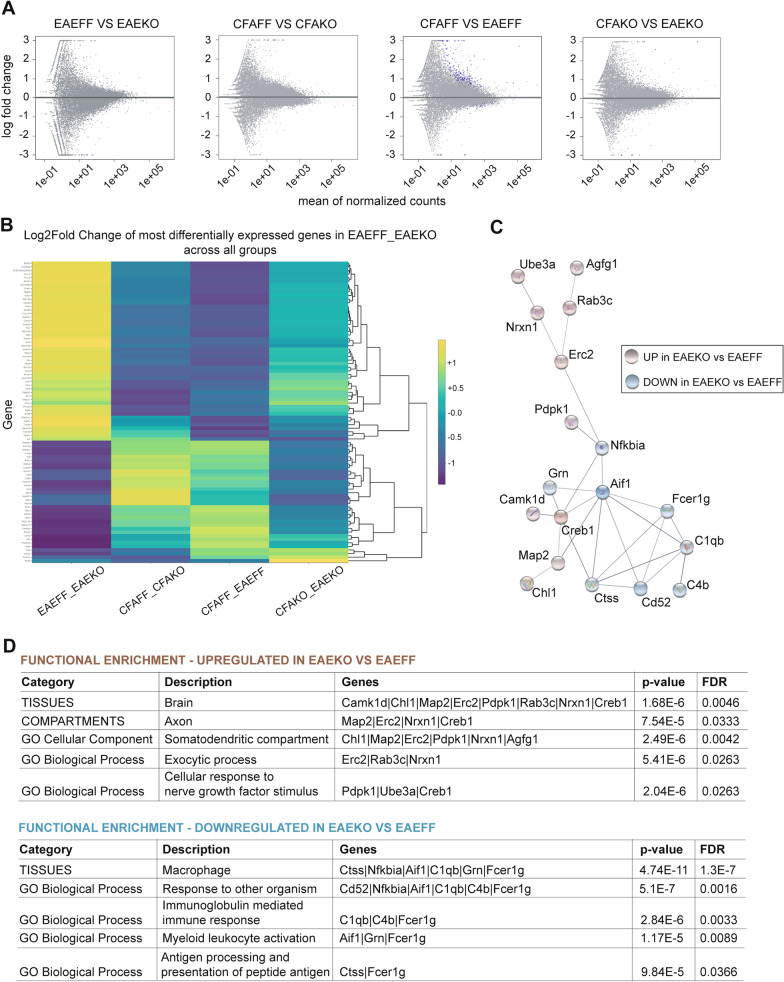
Fig. 6.
Depletion of IKKβ from CNS macrophages results in macrophagic and neuronal gene alterations in EAE. Summary of the RNA-seq results. A Volcano plot representation of the DEGs per comparison. Blue dots represent significant (Padj < 0.05) log2FoldChanges. The x-axis shows the normalized counts per gene and the y-axis shows the Log2FoldChange. B Heatmap of the most significant DEGs in the EAEFF_EAEKO group across all other groups. Values have been scaled (R package heatmaply [31]) for a better visualization. C PPI network of the most significant DEGs in the EAEFF_EAEKO group. Blue color nodes represent down-regulation of the gene while red color nodes represent upregulation

