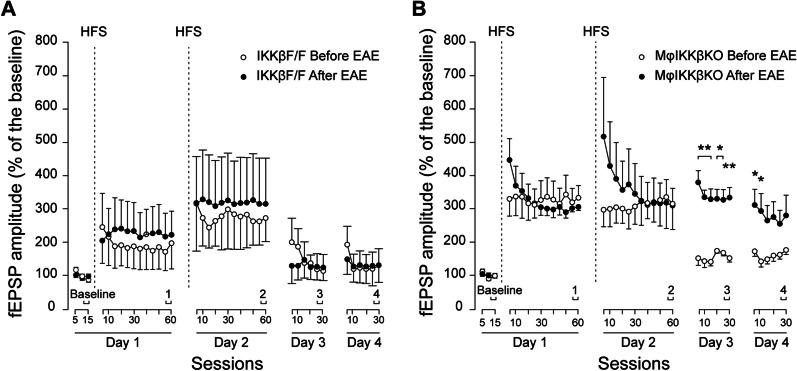
Fig. 8.
Global depletion of IKKβ from myeloid cells results in enhanced late-LTP. A Graph illustrating the time course of changes in fEPSP amplitudes (i.e., the LTP) after HFS of the Schaffer collaterals in IKKβF/F male mice before and at dpi 23 after MOG35-55-induced EAE, (n = 4). The HFS train was presented after 15 min of baseline recordings on 2 consecutive days, at the time indicated by the vertical dashed lines. The fEPSP amplitudes are expressed as a percentage of the baseline (Day 1, before HFS) amplitude (100%) in each group. Illustrated data were collected up to 60 min after HFS during the first (Day 1) and second (Day 2) days, and for 30 min on Days 3, 4, 5, and 6 after the first HFS. B Graph illustrating the time course of changes in fEPSP amplitudes (LTP) after HFS of the Schaffer collaterals in ΜφΙΚΚβΚΟ male mice before and at dpi 23 after MOG35-55-induced EAE, (n = 4). The HFS train was presented after 15 min of baseline recordings on 2 consecutive days, at the time indicated by the vertical dashed lines. The fEPSP amplitudes are expressed as a percentage of the baseline (Day 1, before HFS) amplitude (100%) in each group. Illustrated data were collected up to 60 min after HFS during the first (Day 1) and second (Day 2) days, and for 30 min on Days 3, 4, 5, and 6 after the first HFS. All mice in this graph were adult males, 3–5 months old. Data are shown as mean ± SEM and statistical analysis by two-way ANOVA, repeated measures, with Fisher LSD post hoc

