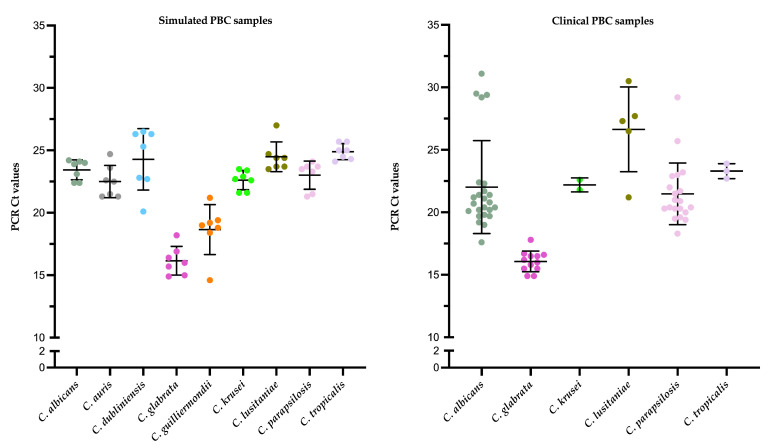
Figure 4.
Distribution of PCR Ct values for simulated or clinical PBC samples with DNAs that were tested with the MM YBL chip assay. Values were grouped according to the Candida species detected. In each scatter dot plot (a different color is used to mark each Candida species), the central line indicates the mean Ct value, and the area between the top and bottom lines indicates the standard deviation value. There was statistical significance (p < 0.001) between groups of simulated or clinical PBC samples, as assessed using a one-way analysis of variance (ANOVA) with Tukey’s multiple-comparison test. Ct, cycle threshold.

