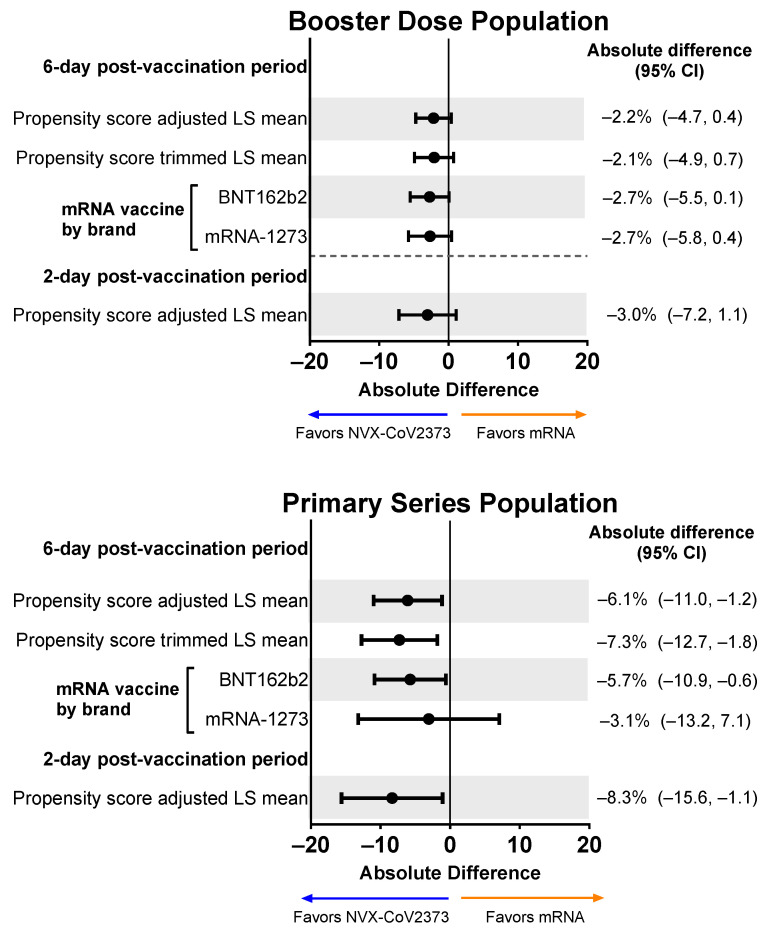
Figure 5.
Forest plots showing estimated differences (NVX-CoV2373—mRNA) of the mean percentage of overall work impairment. Results are shown for the Booster Dose and Primary Series Populations. Overall work impairment was a summary score estimated using the sum of hours reported (hours missed and hours worked) and the average of the impairment scores from the daily diary collected over the post-vaccination period. LS means and 95% Cis were derived from a propensity score weighted ANOVA model for the comparison of the NVX-CoV2373 and mRNA vaccine groups. LS, least squares.

