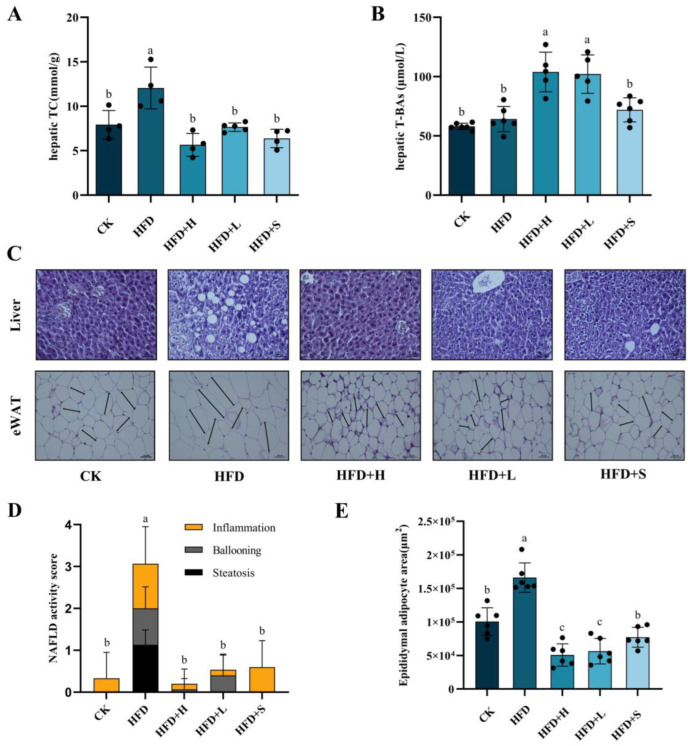
Figure 1.
The levels of total cholesterol (TC), total bile acids (T-BAs), and indicators of liver damage were meticulously assessed. Panels (A,B) illustrate the concentrations of hepatic TC and T-BAs, respectively. Panel (C) displays representative histological images of liver and fat sections, stained with hematoxylin and eosin (H&E) at 200× magnification and the scale bar is 200 μm. The NAFLD Activity Score (NAS) of liver sections is depicted in panel (D), while panel (E) presents an analysis of adipocyte size within fat sections. The data are presented as mean ± SD. Statistically significant differences among the multiple groups (P < 0.05) are denoted by distinct letters, highlighting the differential impacts of these treatments on liver health and adiposity. CK: mice fed a standard chow diet with normal saline. HFD: mice fed a high-fat diet with normal saline. HFD+H: mice fed a high-fat diet with high-dose PPE (400 mg/kg/day). HFD+L: mice fed a high-fat diet with low-dose PPE (200 mg/kg/day). HFD+S: mice fed a high-fat diet with statin (10 mg/kg/day).

