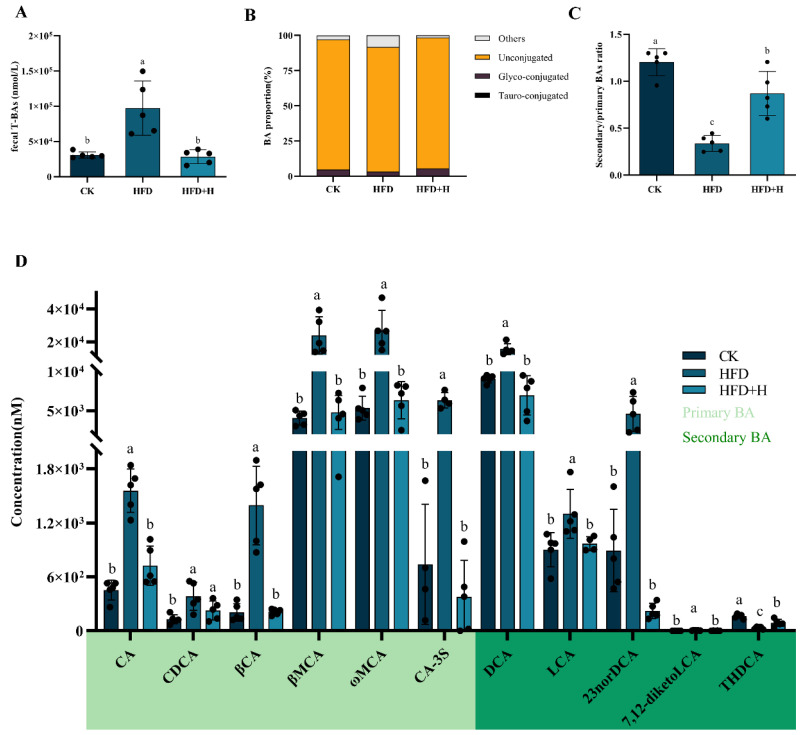
Figure 3.
PPE’s impact on mice fecal BAs profile: utilizing UHPLC-MS/MS for targeted metabolomics, we analyzed mouse feces to assess (A) fecal total bile acid (T-BA) concentrations, (B) ratios of conjugated and unconjugated BAs, (C) secondary/primary BAs ratio, and (D) levels of various primary and secondary BAs. Data are presented as mean ± SD (n = 5), with different letters indicating significant differences across groups (p < 0.05). CK: mice fed a standard chow diet with normal saline. HFD: mice fed a high-fat diet with normal saline. HFD+H: mice fed a high-fat diet with high-dose PPE (400 mg/kg/day). HFD+L: mice fed a high-fat diet with low-dose PPE (200 mg/kg/day). HFD+S: mice fed a high-fat diet with statin (10 mg/kg/day). CA: cholic acid. CDCA: chenodeoxycholic acid. βCA: β-cholic acid. βMCA: β-muricholic acid. ωMCA: ω-muricholic acid. CA-3S: cholic acid-3-sulfate. DCA: deoxycholic acid. LCA: lithocholic acid. 23norDCA: 23-nordeoxycholic acid. 7,12-diketoLCA: 7,12-diketolithocholic acid. THDCA: taurohyodeoxycholic acid.

