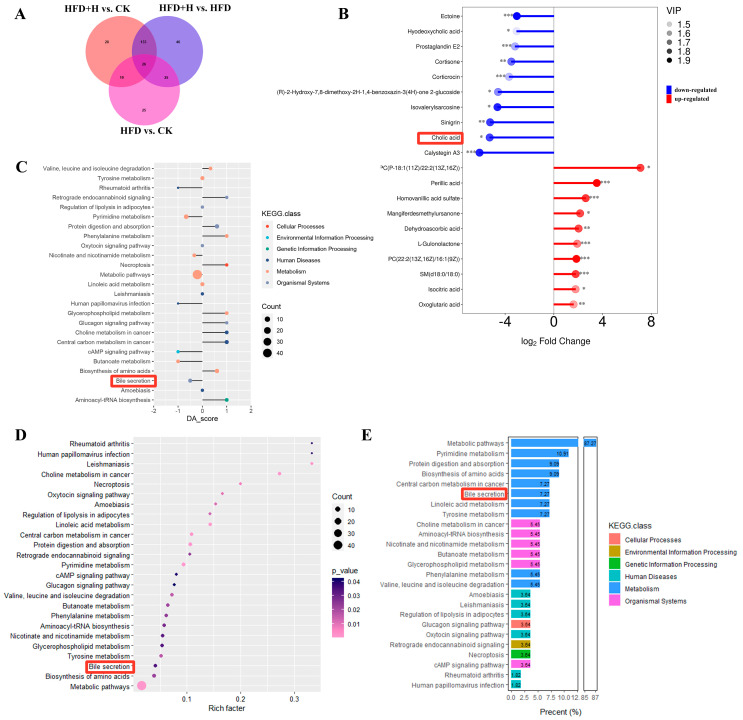
Figure 6.
Effects of PPE on serum metabolic profile in mice. (A) Veen plot of differential metabolites. (B) Matchstick plot of differential metabolites. (C) KEGG pathway enrichment analysis matchstick plot. (D) KEGG pathway enrichment analysis bubble chart. (E) Detected metabolite proportion histogram. * P ≤ 0.05, ** P ≤ 0.01, *** P ≤ 0.001. (B–E) red frames: metabolites and pathways related to BA in serum metabolic profile. CK: mice fed a standard chow diet with normal saline. HFD: mice fed a high-fat diet with normal saline. HFD+H: mice fed a high-fat diet with high-dose PPE (400 mg/kg/day).

