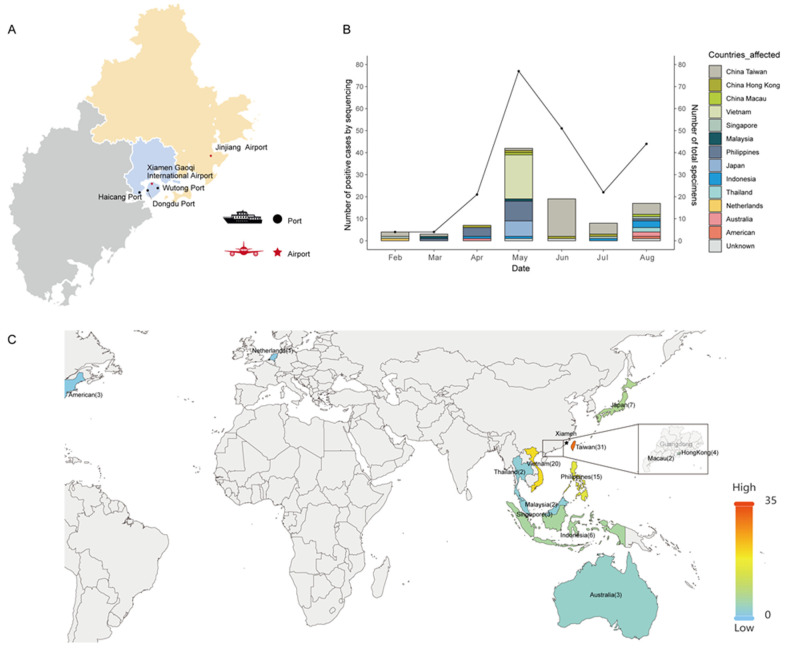
Figure 1.
Spatial and temporal distribution of imported SARS-CoV-2 cases for countries or regions from which travelers entered Xiamen. (A) The location of the five international sampling sites for imported SARS-CoV-2 cases through Xiamen city. Black circles denote the ports accessed by ferry. The red stars correspond to the airports accessed by flight. (B) Monthly distribution of imported SARS-CoV-2 variants isolated and sequenced from incoming travelers at Xiamen International Airport and the Port of Xiamen entry border between February and August 2023. The bars represent the number of SARS-CoV-2 sequenced cases. The colors of the bars represent the countries or regions from which travelers entered Xiamen. The plotted line represents the number of sampling specimens. (C) Map showing the number of sequences with recorded travel history per country or region to describe geographic transmission lines to Xiamen, with more intense red colors representing more sequenced samples. Though few sequences are available from Hong Kong and Macau, these travel history data are highlighted to provide further details. The black stars correspond to the location of Xiamen city.

