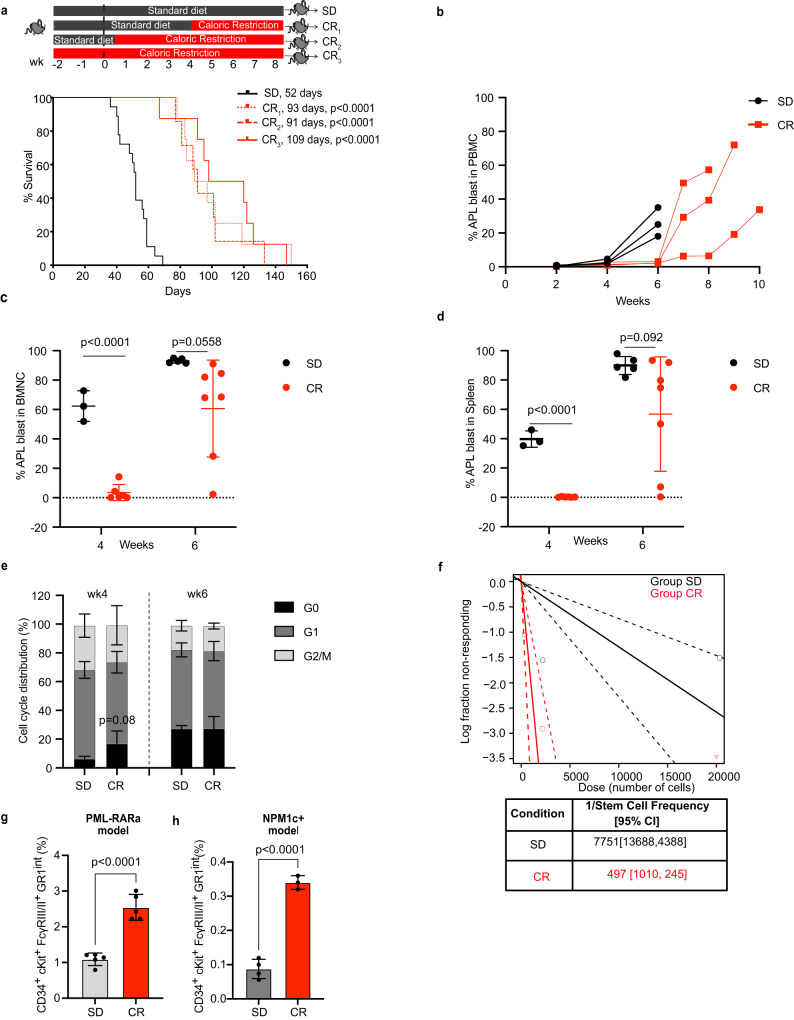
Fig. 1. CR induces transient inhibition of leukemia growth but increases numbers of CR-adapted Leukemia Initiating Cells.
a Schematic representation (upper panel) and Kaplan–Meier survival curve (lower panel) of mice injected with 2 ×10⁶ APL cells and randomized to standard diet (SD, n = 18) or caloric restriction (CR) initiated 4 weeks after injection (CR1, n = 8), 2 days after injection (CR2, n = 7) or 2 weeks before injection (CR3, n = 8). All CR-fed mice showed a survival advantage with a median survival of 93 days, p < 0.0001 in CR1; 91 days, p < 0.0001 in CR2 and 109 days in CR3, p < 0.0001, as compared to 52 days in SD. Statistical analysis was performed using log-rank (Mantel–Cox) test. b Kinetics of APL blasts (CD45.2+) in the peripheral blood of individual recipient CD45.1+ mice subjected to SD or CR3 (n = 3 mice per group). APL blasts (CD45.2+) in the BM (c) or spleen (d) of recipient CD45.1+ mice subjected to SD or CR3, 4 (SD, n = 3; CR, n = 6) or 6 (SD, n = 5; CR, n = 7) weeks after APL injection. e Cell cycle analysis of APL blasts in the BM at 4 (SD, n = 4; CR, n = 4) and 6 (SD, n = 4; CR, n = 3) weeks post-injection. f A log fraction plot of limiting dilution model fitted to the data (Supplementary Fig. 1e) by ELDA. Dotted line represents the 95% of confidence interval (upper). Table reporting the LIC frequency with confidence intervals (lower). Relative frequency of the CD34+, c-Kit+, FcγRIII/II+, Gr1int subpopulation in SD and CR APLs (p < 0.0001, SD, n = 5; CR, n = 5) (g) and SD and CR NPM1c+ AMLs (p < 0.0001, SD, n = 4; CR, n = 3) (h). Data are expressed as mean ± SD for c–e, g and h. Statistical analysis was performed using two-tailed t-test for c–e, g and h. Here ‘n’ represents number of mice/groups. Source data are provided as a Source Data file.

