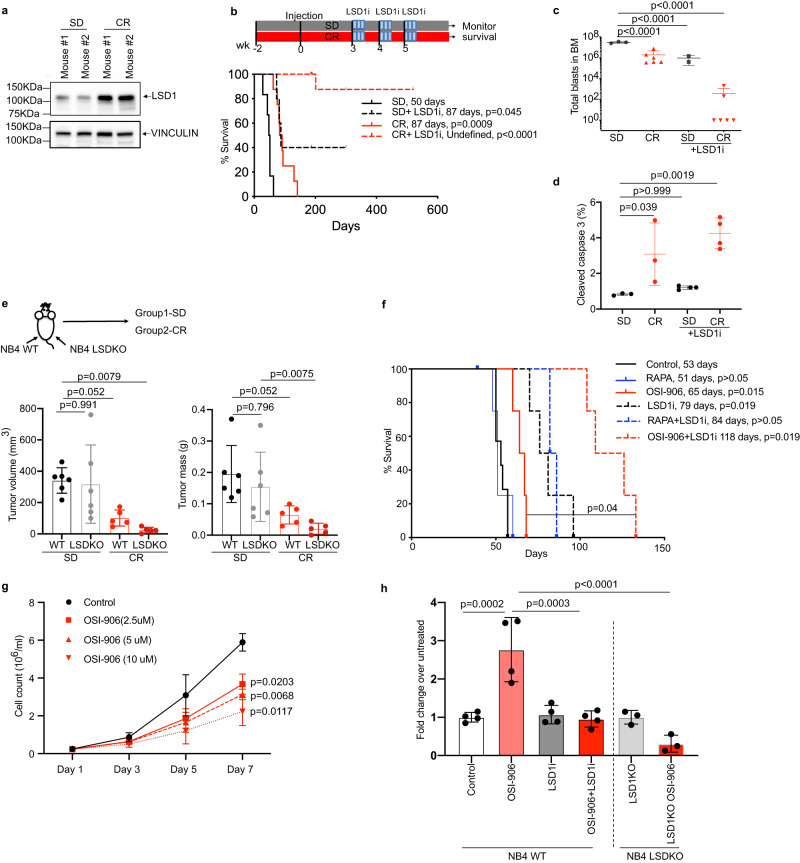
Fig. 3. LSD1 inhibition eradicates leukemia in CR-treated mice.
a LSD1 expression in CR and SD in the BM analyzed by WB using specific anti-LSD1 antibody (representative of 3 independent experiments). b Effect of LSD1i on survival of APL-bearing mice. Schematic representation (upper panel) and Kaplan–Meier survival curve (lower panel) after LSD1 inhibition under SD and CR diet. Median survival in days and p values, with SD as a common control (log-rank test, Bonferroni-adjusted) are indicated. SD+LSD1i (n = 5), CR (n = 8; vehicle), CR+LSD1i (n = 9), SD (n = 6; vehicle). Quantification of total numbers of APL-blast (in c by FACS; SD, n = 3; CR, n = 6; SD+LSD1i, n = 2; CR+LSD1i, n = 6) and frequency of apoptotic cells (in d; SD, n = 3; CR, n = 3; SD+LSD1i, n = 4; CR+LSD1i, n = 4; the SD and CR group is same in Supplementary Fig 1l. e Impact of CR on growth of NB4 cells. Upper panel: experimental scheme. NSG mice injected subcutaneously with 106 WT (wild-type) (left flank) or LSD1 KO (knockout) (right flank) NB4 cells, fed SD (n = 6) or CR (n = 5), sacrificed after 20 days to measure tumor volume (lower left panel) and mass (lower right panel). f Kaplan–Meier survival curves of APL recipient mice subjected to vehicle (40% PEG), rapamycin (RAPA) (4 mg/kg) or OSI-906 (20 mg/kg), alone or in combination with LSD1i (DDP37368) (45 mg/kg). The median survival in days and P values, with SD as a common control (log-rank test, Bonferroni-adjusted) are indicated. RAPA (n = 4), OSI-906 (n = 4), SD+LSD1i (n = 4), RAPA+ LSD1i (n = 3), OSI-906 + LSD1i (n = 4) with SD (n = 7; vehicle). g Effect of OSI-906 treatment on NB4-cell growth in vitro (n = 3 biological replicates). Data are expressed as mean ± SD, one way (for c–e, h) and two-way (g) ANOVA with post-hoc Tukey’s multiple comparison. ‘n’ represents number of mice/groups for b–f, adjusted p values indicated. h Effect of OSI-906 treatment and LSD1 ablation on NB4 colony formation (two separate sets of experiments, n = 4 biological replicates for WT NB4, left panel, n = 3 biological replicates for LSD1 KO cells, right panel). For h, data are normalized on the average of the relative untreated control and expressed as mean ± SD. Source data are provided as a Source Data file.

