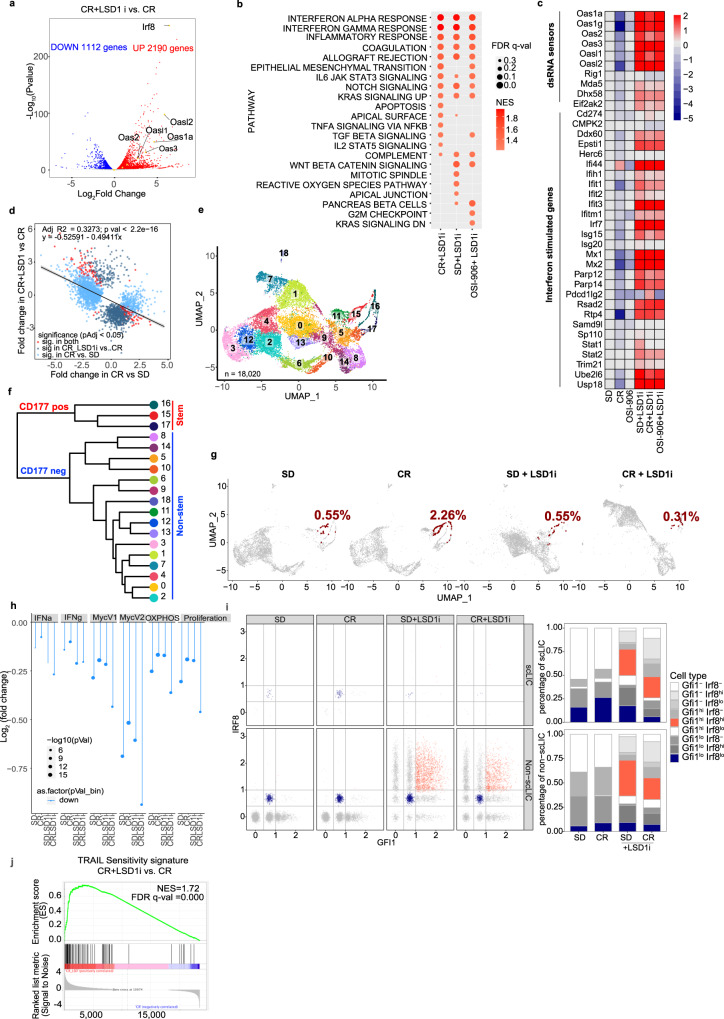
Fig. 4. LSD1 inhibition de-represses endogenous-dsRNAs expression and reduces numbers of CD177 + APL cells with stem-like properties.
a Volcano plot showing differentially expressed genes in CR+LSD1i and CR APL blasts. Genes in red/blue are significantly up/down regulated (FDR < 0.05). Relevant ISGs are highlighted. b Top hallmark gene sets (from MSigDB) enriched in SD, CR and OSI-906 APLs treated with LSD1 inhibitor. The color of the dot indicates the normalized enrichment scores (NES) and size of the dot indicates the FDR q values. Only dots with an FDR < 0.25 are reported. c Heatmap of log2 fold-change regulation in dsRNA-sensing and ISGs genes relative to SD untreated APLs. The color scale indicates the log2 fold-change. d Linear regression analysis of fold change regulation in ERV expression showing LSD1-inhibition - dependent de-repression of dsRNA-inducing ERVs in CR. e UMAP visualization of scRNAseq data from of 18,020 cells grouped in 19 clusters. Cells are colored by clusters. f Hierarchical clustering highlighting the first bifurcation on Cd177 positivity: stem-like clusters 15-17 vs all other non-stem clusters. g UMAP visualization of cells split by treatment conditions (SD, CR, SD+LSD1i, and CR+LSD1i, as indicated). Cd177 + Cd34+ cells are highlighted in red and their frequency per condition is indicated. h Average log2 fold change (scLIC vs non-scLIC) in genes belonging to the indicated Hallmark gene sets in the scRNAseq data, by treatment condition. i Expression of Gfi1 and Irf8 within the scLIC (Cd34 + /Cd177hi) and non-scLIC (non-Cd34 + /Cd177hi) cells in the scRNAseq. Left panel shows expression levels (normalized counts), right panels show the corresponding fraction of cells (expressed as percentage of normal/gated). j GSEA plots showing enrichment of TRAIL sensitivity signature upon DDP treatment in CR and SD samples. NES, normalized enrichment score. Source data are provided as a Source Data file.

