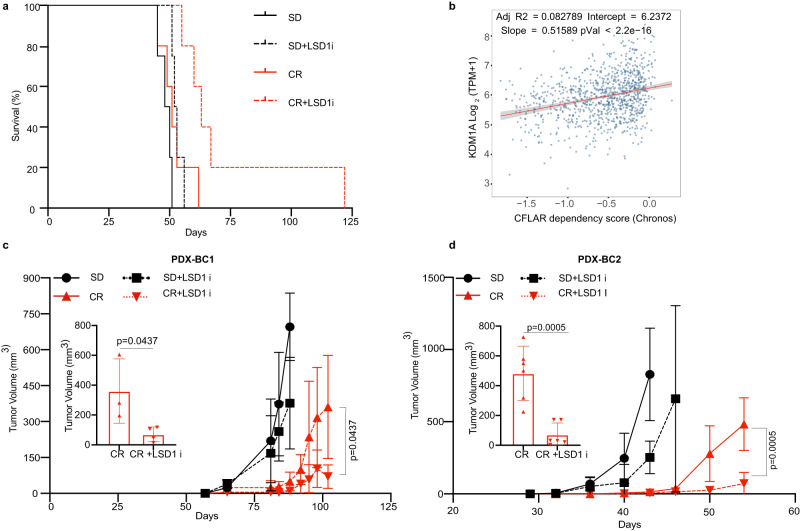
Fig. 6. LSD1 inhibition synergizes with CR in other AMLs and breast cancer.
a Kaplan–Meier survival curve of leukemia-bearing mice fed SD or CR and treated or not with LSD1i: AML-IEO20 PDX with the MLL-AF9 translocation (SD, n = 4; CR, n = 5; SD+LSD1i, n = 4; CR+LSD1i, n = 5) (p = 0.02; CR +LSD1i vs. CR). “n” represents the number mice per group. Statistical analysis was performed using log-rank (Mantel–Cox) test. b DEPMAP analysis of CFLAR dependency vs LSD1 (KDM1A). Linear regression parameters are overlayed. Impact of CR and LSD1 inhibition on tumor growth of PDX-BC1 (c) and PDX-BC2 (d) over time. Inserts show tumor growth at the end of the observation period (102 days for PDX-BC1 and 54 days for PDX-BC2 for CR and CR+LSD1i group as indicated. For PDX-BC1 (SD, n = 5; CR, n = 3; SD+LSD1i, n = 6; CR+LSD1i, n = 4) and for PDX-BC2, (SD, n = 8; CR, n = 6; SD+LSD1i, n = 8; CR+LSD1i, n = 6) where “n” is the number mice per group. Mice with non-palpable tumor during the entire experiment were removed from the analysis. Data are shown as mean ± SD. Statistical analysis was performed using two tailed t-test between CR and CR+LSD1i group. Source data are provided as a Source Data file.

