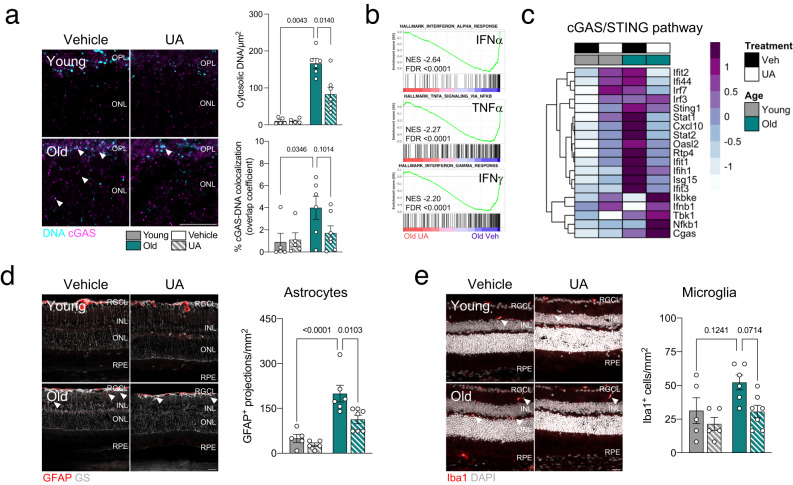
Fig. 5. UA treatment attenuates the increased cGAS/STING response observed in old mice.
a Immunostaining for cGAS (magenta) and DNA (cyan): representative images and colocalization analysis (n = 5–7 mice). b Top three negatively enriched Hallmarks in old retinas treated with UA (2.3 mg/kg/day) versus vehicle: IFNα and IFNγ responses and TNFα signaling. c Heatmap showing expression levels of cGAS/STING pathway modulators in old retinas treated with UA or vehicle. d Representative images and quantification of GFAP+ astrocytic gliosis (red) analysis by immunostaining (n = 5–7 mice). Müller glia and astrocytes were counterstained using Glutamine Synthetase (GS). e Immunostaining for Iba1+ microglial infiltration (red): representative images and corresponding quantification (n = 5–7 mice). Scale bar, 25 μm (a, d, e). All data are expressed as the mean ± s.e.m. Dots represent individual mice. P values were calculated using the two-tailed Mann–Whitney U-test (a) or 2-way ANOVA with Tukey’s post-hoc test (d, e). Source data are provided as a Source Data file.

