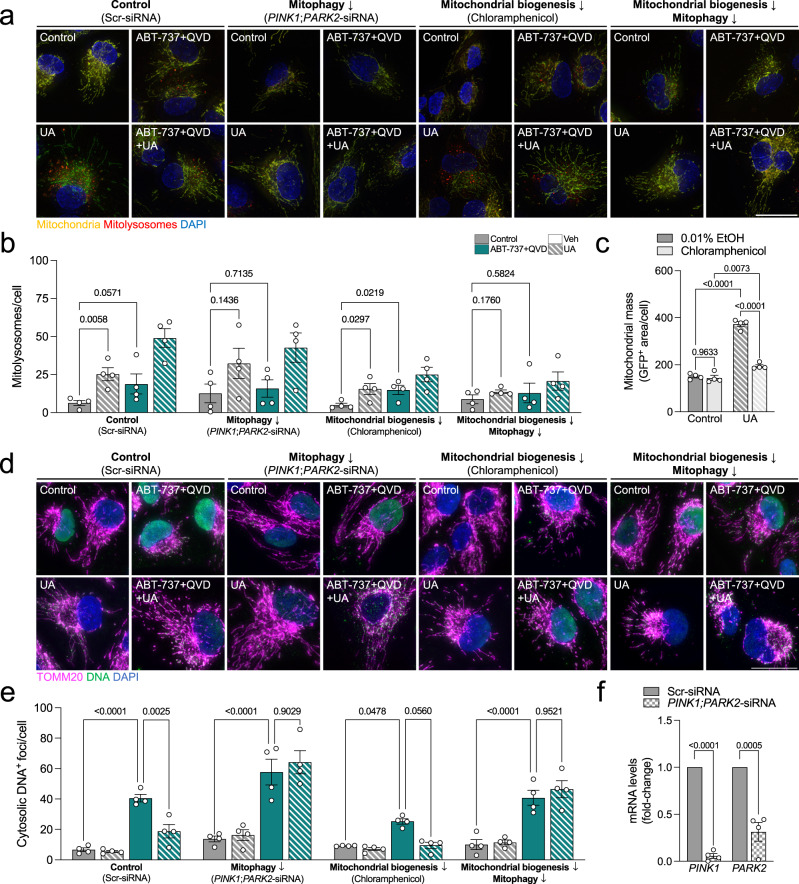
Fig. 7. PINK1/Parkin-dependent mitophagy stimulation by UA mediates cytosolic ABT-737-induced DNA decrease.
a Representative images of ARPE-19 cells expressing the mito-QC reporter which subjected to PINK1/Parkin-depedent mitophagy (PINK1; PARK2 knockdown) and/or mitochondrial biogenesis (100 μM Chloramphenicol) inhibition, and simultaneously treated with ABT-737 and/or UA. b Quantification of the number of mitolysosomes per cell as shown in Fig. 7a (n = 4 independent experiments). c Quantification of mitochondrial mass in the presence or absence of Chloramphenicol to validate UA-induced mitochondrial biogenesis inhibition, as reported in Fig. 4a, f (n = 4 independent experiments). d Representative images showing immunostaining of ARPE-19 cells for DNA (green) and TOMM20 (magenta, mitochondria). e Quantification of the number of cytosolic DNA foci per cell as shown in Fig. 7d (n = 4 independent experiments). f Quantification of PINK1 and PARK2 mRNA levels to validate siRNA-mediated knockdown efficiency (n = 4 independent experiments). Scale bars, 25 μm. All data are expressed as the mean ± s.e.m. Dots represent independent experiments. P values were calculated using two-tailed Student’s t test (b, c) or two-tailed Mann–Whitney’s U-test (b, Control:Control vs Control:ABT), 1-way ANOVA with Šídák’s post-hoc test (e) or 2-way ANOVA with Šídák’s post-hoc test (f). Source data are provided as a Source Data file.

