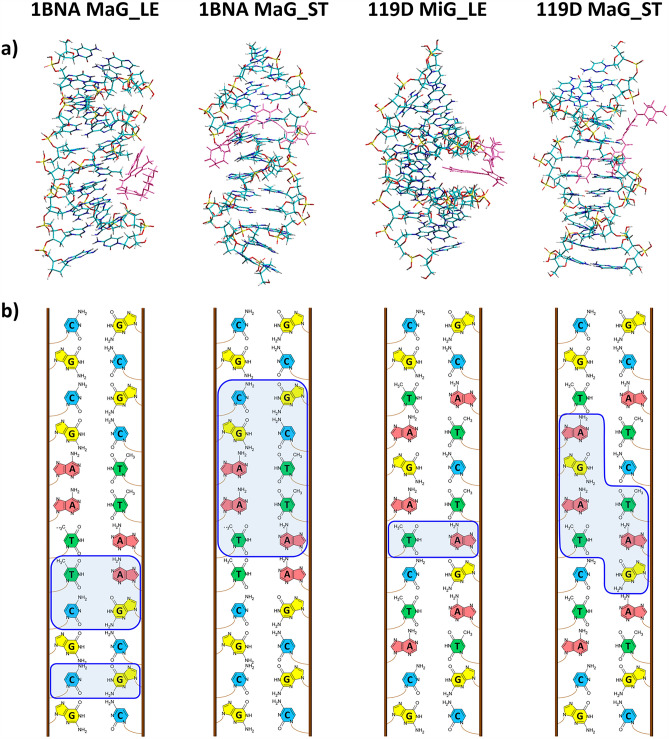
Figure 11.
Structures of the most stable configurations obtained from the DFT calculations for the four different models of the dsDNA:PNT complexes (a) and the corresponding schematic images of the dsDNA sequence, on which the nucleobases closest to PNT are outlined with a blue line (b). In (a), the dsDNA atom colors are the same as in Fig. 8, while the PNT molecule is colored pink. Nucleobases symbols in (b): A—adenine, G—guanine, C—cytosine, T—thymine.

