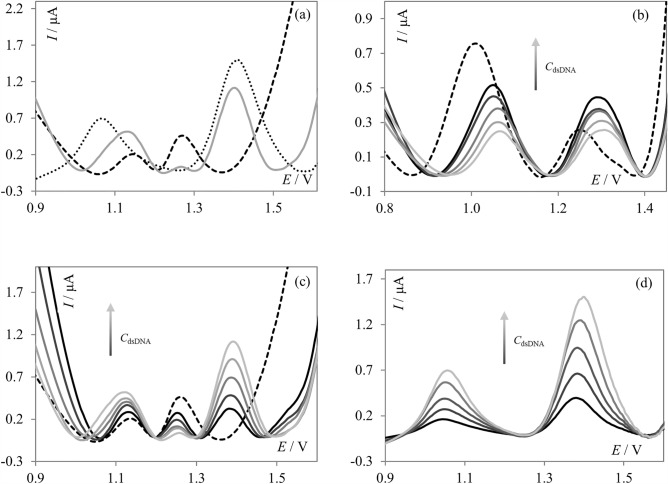
Figure 6.
(a) SW voltammograms of PNT (dashed, black line), PNT in the presence of dsDNA (solid, gray line), and dsDNA (dotted, black line) recorded in acetate buffer of pH 4.7; cPNT = 5.0 µmol L−1, cdsDNA = 80 mg L−1; (b) SW voltammograms of PNT (dashed, black line) recorded in PBS of pH 7.4, in the presence of an increasing amount of dsDNA (solid, gray lines), cPNT = 5.0 µmol L−1, cdsDNA = 10—80 mg L−1; (c) SW voltammograms of PNT (dashed, black line) recorded in acetate buffer of pH 4.7, in the presence of increasing amount of dsDNA (solid, gray lines), cPNT = 5.0 µmol L−1, cdsDNA = 10–80 mg L−1; and (d) SW voltammograms of dsDNA and its increasing concentration recorded in acetate buffer of pH 4.7, cdsDNA = 10–80 mg L−1.

