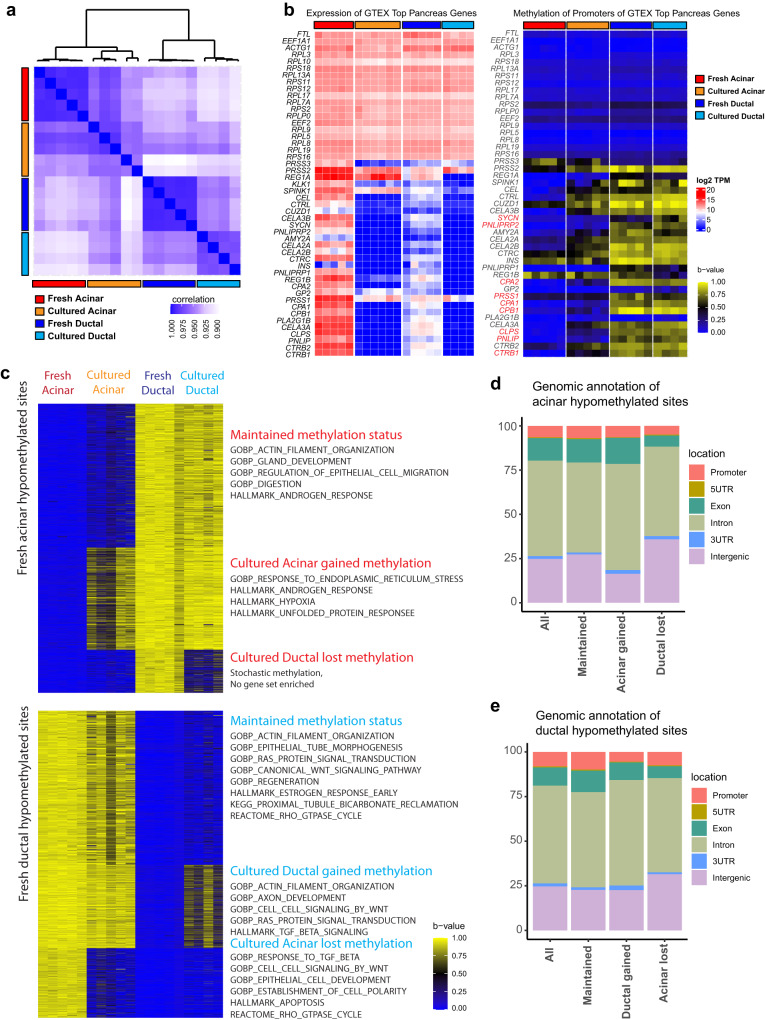
Fig. 2. Verification of cultured cell identity by DNA methylation status.
a Correlation matrix of DNA methylation profiles of fresh acinar (n = 5), cultured acinar (n = 5), fresh ductal (n = 5) and cultured ductal cells (n = 4) by all surveyed methylation sites. b Expression heatmap (left) and DNA methylation status (right) of the promoters of the top genes expressed in the pancreas according to the GTEx database, in fresh and cultured cells of each lineage. c DNA methylation status in fresh and cultured cells of the mostly highly acinar hypomethylated sites (top, beta-value difference >0.8) and ductal hypomethylated sites (bottom). K means clustering identified 3 subgroups of sites with distinct methylation pattern across all groups of samples. Overrepresentation analysis for genes associated with each subgroup of sites was performed, with selected enriched gene sets annotated alongside their corresponding clusters. d Distribution of each subgroup of sites in (c, top) with reference to proximal genomic features. e Distribution of each subgroup of sites in (c, bottom) with reference to proximal genomic features.

