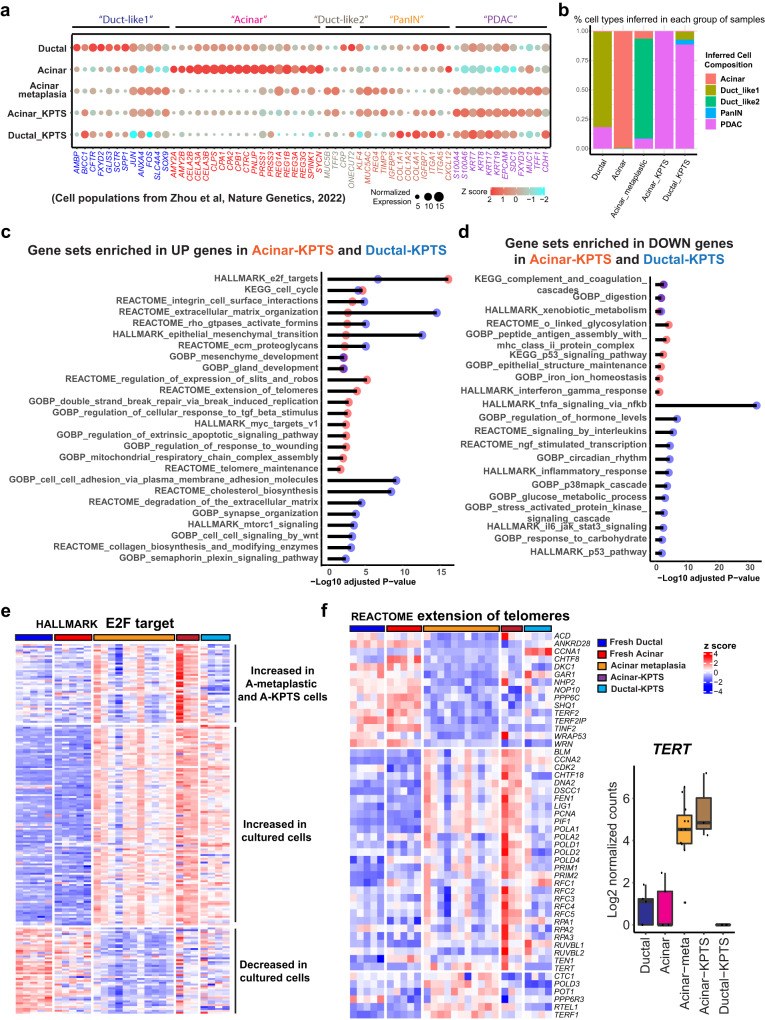
Fig. 4. Transcriptomic reprograming in oncogenic cells derived from acinar and ductal lineages.
a Expression of indicated cell type signature genes (columns, identified from indicated reference) in our fresh, metaplastic, and KPTS cells (rows). The dot size is proportional to the normalized read counts, the color represents z score of gene expression. b Bar plot of inferred cell type composition in our samples using treatment naive human PDAC scRNA seq samples (described in the indicated work as shown in a) as a reference. The bulk RNA sample deconvolution was performed by using MuSiC method. c Overrepresentation analysis for upregulated genes in Acinar-KPTS cells (vs Acinar-metaplastic cells) and in Ductal-KPTS cells (vs fresh ductal cells). Overrepresentation analysis was performed using the clusterProfiler 4.4.4 package in R software with default settings. A significant enrichment was considered with multiple-test adjusted p value < 0.05. d Overrepresentation analysis for downregulated genes in Acinar-KPTS cells (vs Acinar-metaplastic cells) and in Ductal-KPTS cells (vs fresh ductal cells). The analysis was performed using the clusterProfiler 4.4.4 package. A significant enrichment was considered with multiple-test adjusted p value < 0.05. e Expression heatmap of HALLMARK E2F target genes in fresh, metaplastic, and KPTS cells. K means clustering was performed to identify different expression patterns across all groups of samples. f Left: Expression heatmap of genes in the REACTOME extension of telomeres gene set in fresh, metaplastic, and KPTS cells. Right: Boxplot of TERT expression in all groups of samples. The middle line of box represents the median value, the bounds of box represent the IQR, and the whiskers extend to 1.5 × IQR. Fresh ductal n = 5, fresh acinar n = 5, acinar-metaplastic n = 11, acinar-KPTS n = 3, ductal-KPTS n = 4.

