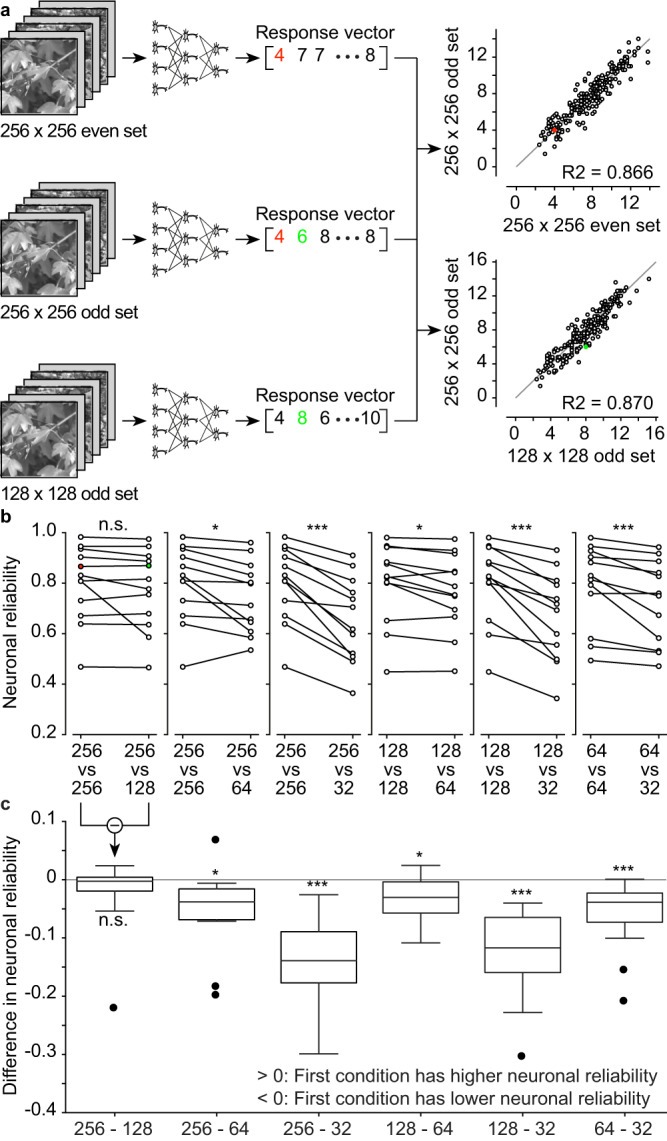
Fig. 2. Dimension for high-resolution images.

a Neuronal reliability of a RGC to the same image dimension (256 ×256 pixels) or to different image dimensions (256 x 256 pixels vs 128 ×128 pixels). The scatter plots are built from the response vectors. The red and green dots correspond to the red and green numbers in the response vectors. The gray lines are the identity lines. b Plots of the paired neuronal reliabilities for all the recorded RGCs (n = 12 RGCs from N = 3 retinas). c, Each boxplot is the distribution of the pairwise difference in neuronal reliability from panel b. The box spans from 25th to the 75th percentiles, the line is the median, and the whiskers are 1.5 times the interquartile range. The black dots indicate outliers. Two-tailed paired Wilcoxon tests: 256 − 128 (p = 0.30, reported as n.s.), 256 − 64 (p = 0.0122, reported as *), 256 − 32 (p = 0.0005, reported as ***), 128 − 64 (p = 0.0200, reported as *), 128 − 32 (p = 0.0005, reported as ***), 64 − 32 (p = 0.0009, reported as ***). Statistical analysis applies to both panels b and c. High-resolution image reproduced from the Open Access van Hateren Natural Image Dataset available at https://github.com/hunse/vanhateren (MIT License).
