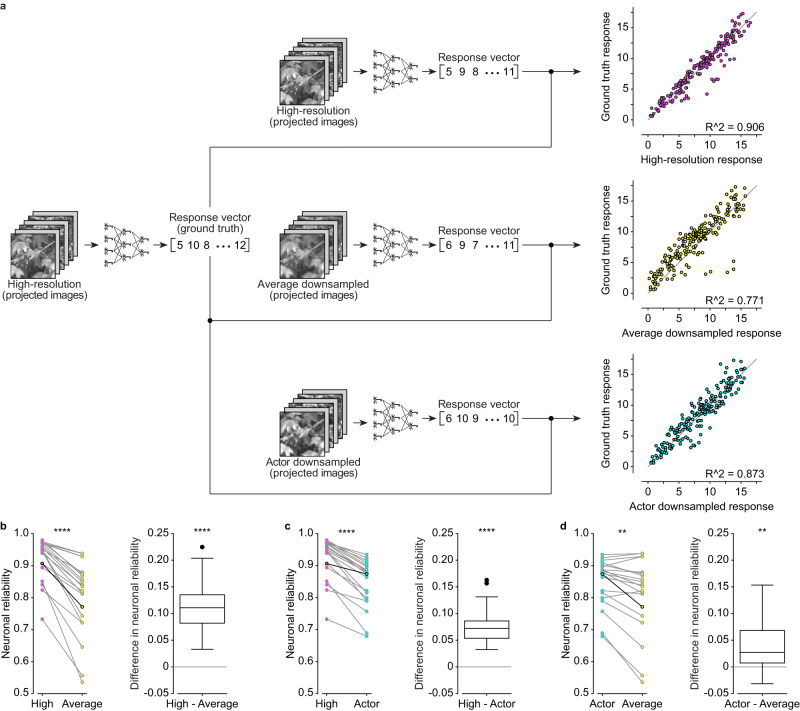
Fig. 5. Results ex-vivo for four-fold downsampling.
a High-resolution, actor downsampled and average downsample images are projected onto retinas explanted over a MEA. On the right there are the scatter plots of the same RGC from which the R2 value between the obtained responses and the ground truth response is computed. The gray line is the identity line. b–d The left plots are the paired distribution of neuronal reliabilities for all the RGCs (n = 21 RGCs from N = 8 retinas). Highlighted points correspond to the RGC in a. The boxplots show the distribution of the pairwise difference in neuronal reliability. The box spans from the 25th to the 75th percentiles, the line is the median, and the whiskers are 1.5 times the interquartile range. The black dots indicate outliers. Two-tailed paired Wilcoxon tests: High vs Average (p < 0.0001, reported as ****), High vs Actor (p < 0.0001, reported as ****), Actor vs Average (p = 0.0012, reported as **). High-resolution image reproduced from the Open Access van Hateren Natural Image Dataset available at https://github.com/hunse/vanhateren (MIT License).

