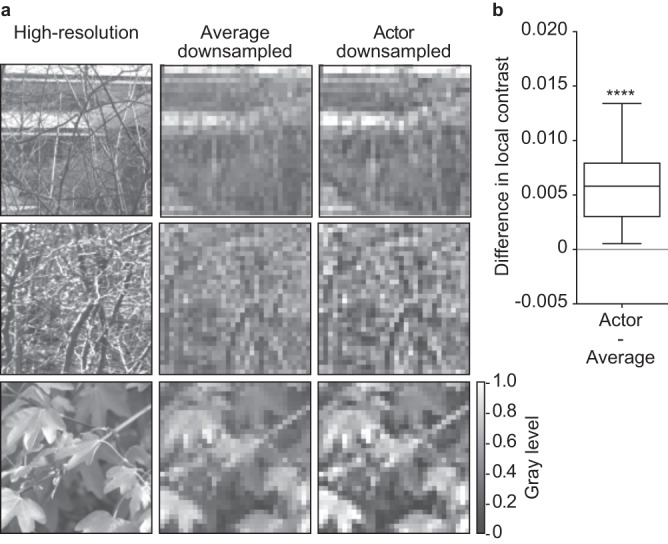
Fig. 6. Actor network preserves contrast.

a On the left, there are three high-resolution images. The same images after four-fold average downsampling (middle) and four-fold actor downsampling (right). b Distribution of the pairwise difference in local contrast between actor and average downsampled images (n = 200 unique images; Two-tailed paired Wilcoxon test, p < 0.0001, reported as ****). The box spans from the 25th to the 75th percentiles, the line is the median, and the whiskers are 1.5 times the interquartile range. High-resolution images reproduced from the Open Access van Hateren Natural Image Dataset available at https://github.com/hunse/vanhateren (MIT License).
