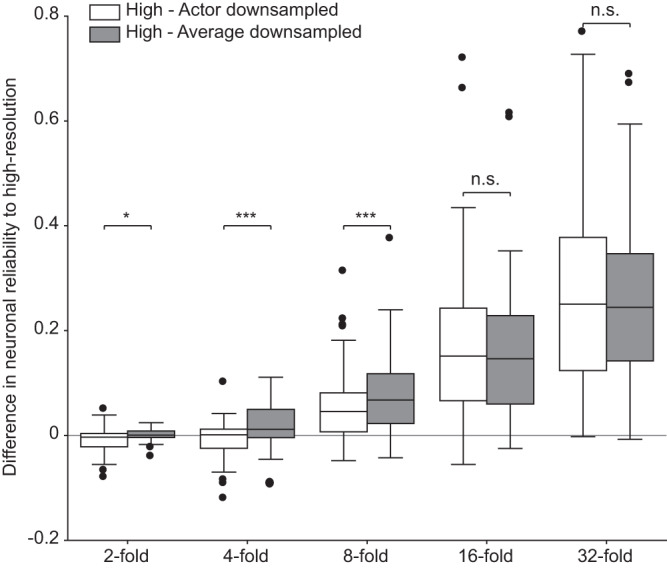
Fig. 9. In-silico difference in neuronal reliability compared to high-resolution images (baseline) for x-fold downsampling.

Each boxplot is the distribution of the pairwise difference in in-silico neuronal reliability between the downsampled images (actor in white and average in gray) and high-resolution images for different downsampling folds (n = 60 modeled neurons). The box spans from the 25th to the 75th percentiles, the line is the median, and the whiskers are 1.5 times the interquartile range. The black dots indicate outliers. Two-tailed paired Wilcoxon tests: 2-fold (p = 0.0178, reported as *), 4-fold (p = 0.0004, reported as ***), 8-fold (p = 0.0006, reported as ***), 16-fold (p = 0.8024, reported as n.s.), 32-fold (p = 0.4483, reported as n.s.).
