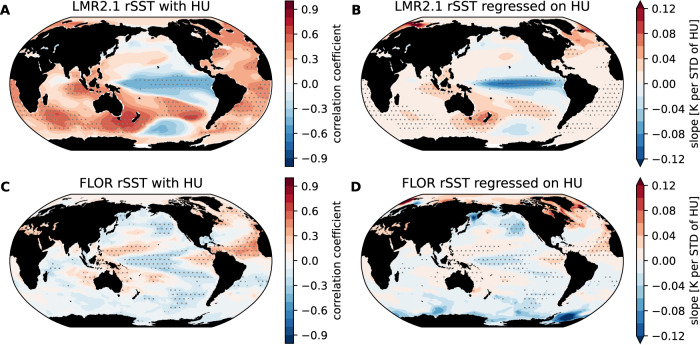
Fig. 3. Relationship between North Atlantic hurricane frequency and global sea surface temperature (SST).
Left and right columns show the correlation (A, C) and slope of linear regression (B, D), respectively. The top row (A, B) shows the sediment-based hurricane reconstruction and last millennium reanalysis (LMR) relative SSTs over the years 850–1850. The bottom row (C, D) shows the explicitly tracked hurricanes from the hurricane-permitting climate model 1860 control experiment (1800 years of simulation). Dots indicate significant values under the two-sided t-test at the 0.1 level using an estimate of effective sample size73. Source data are provided as a Source Data file.

