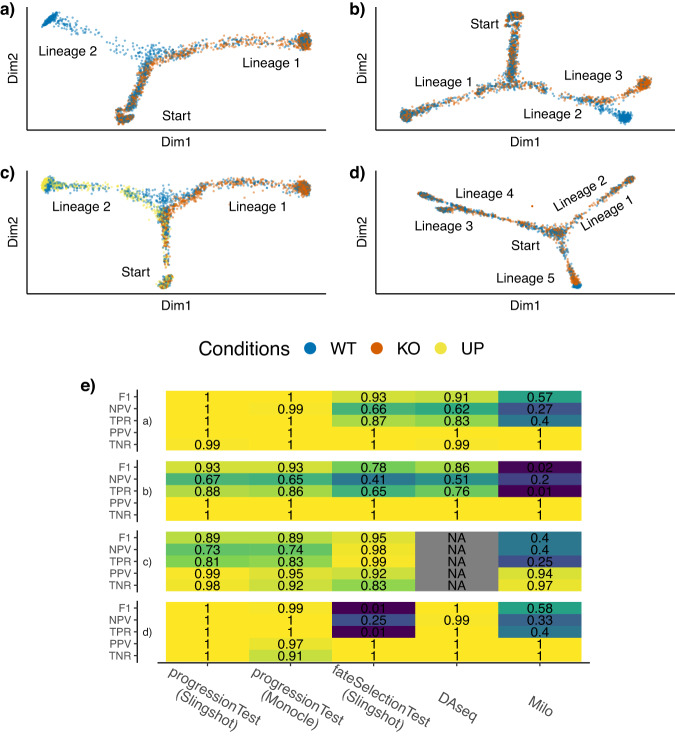
Fig. 2. Simulated datasets.
Four types of datasets are generated, with respectively 2, 3, 2, and 5 lineages, and 2, 2, 3, and 2 conditions (WT - wild type, KO - knock-out, UP - upregulated). Reduced-dimensional representations of these datasets are presented in panels (a–d). Fig. S6 shows the same plot as (d), using dimensions 3 and 4, showing that Lineages 1 and 2 do separate. After generating multiple versions of the datasets for a range of values of m, representing more or less differences between conditions, we compare the performance of the progressionTest after running either slingshot or monocle3; the fateSelectionTest after running slingshot; DAseq17 and milo16, when controlling the false discovery rate at nominal levels of 5% using the Benjamini-Hochberg25 procedure. In (e), each cell of the table represents a performance measure associated with one test on one of the four types of dataset, where the blue-to-yellow color palette corresponds to low-to-high performance. Cells are also colored according to the performance measure. Overall, the progressionTest and fateSelectionTest work well across all datasets. DAseq also has good performances with two conditions, but cannot be extended to more. Exact simulation parameters and performance measures are specified in the Methods section. The poor performance of the fateSelectionTest for (d) is expected, since the effect only appears at the end of Lineage 5, not at the branching itself.

