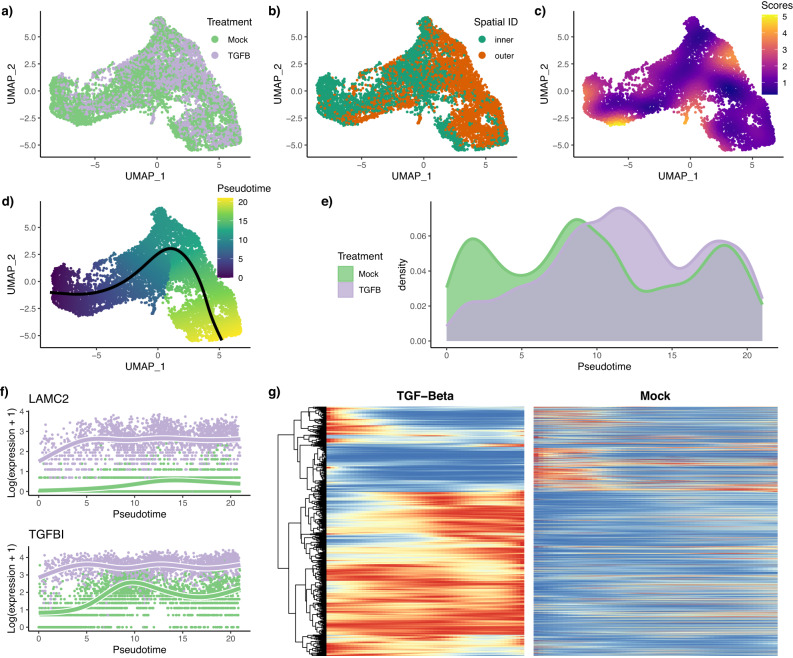
Fig. 3. TGF-β dataset.
Full workflow. After normalization and projection on a reduced-dimensional space (using UMAP), the cells can be colored either by treatment label (a) or spatial origin (b). Using the treatment label and the reduced-dimensional coordinates, an imbalance score is computed and displayed (c). The topologyTest fails to reject the null hypothesis of no differential topology, and a common trajectory is therefore fitted and cells colored according to pseudotime (d). However, there is differential progression between conditions, as indicated by different pseudotime distributions along the trajectory (e), and we reject the null using the progressionTest. The tradeSeq gene expression model is fitted using the trajectory inferred by slingshot. Differential expression between conditions is assessed using the conditionTest and genes are ranked according to their Wald test statistic. The expression measures and fitted values as a function of pseudotime are displayed for the genes with the two highest test statistics (f). After adjusting p-values of the conditionTest to control the FDR at a nominal level of 5%, we display expression fitted values for the DE genes for both conditions using a pseudocolor image, where fitted values are scaled to a [0, 1] range for each gene (blue-to-red color palette represents low-to-high expression) (g).

