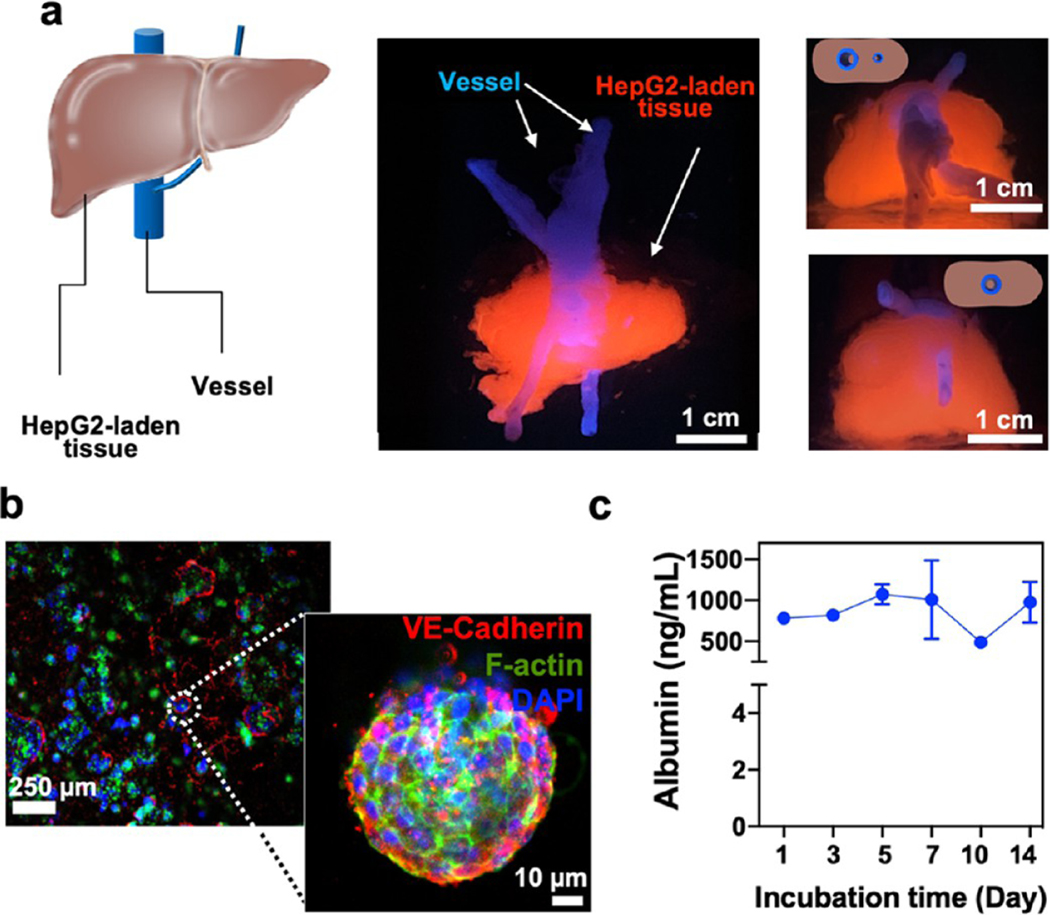
Figure 6.
Cellular prints of liver-like and muscle-like 3D tissues. (a) Schematic and printed liver-like constructs. Front view (middle panel) shows liver-like constructs composed of vessels and HepG2-laden printed tissues. Top (top right) and bottom (bottom right) views show the perfusable channel passing through the length of the construct. (b) Fluorescent images of the printed liver-like construct showing staining for the proliferation of HepG2 cells via staining for VE-cadherin, F-actin, and DAPI after 21 days of culture. High-magnification microphotograph of the formed cellular spheroids within the printed 3D liver-like constructs. c, Albumin levels from the liver-like construct as determined by ELISA over 2 weeks of culture (n = 3).

