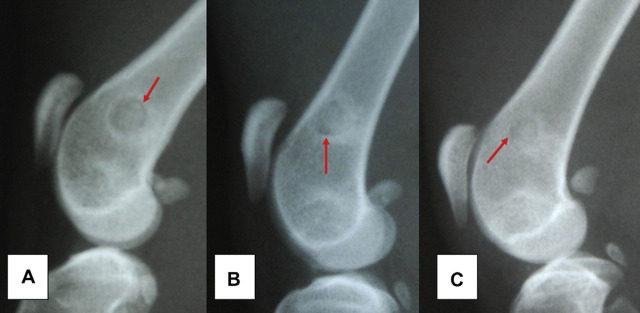
Fig 2.
Radiography of the distal femoral region of cats where it was implanted 70% PHB and a 30% HA composite. Note the reduction of radiolucent line around the implant over time assessment (red arrow). The images identified by the letters (A), (B) and (C) correspond to the time of evaluation 30, 60 and 90 days, respectively.

